
We are not certified professionals. For more information about us please read our Disclaimer.
You Are Here… X
When considering this whole FIRE journey thing, it’s hard to figure out where to focus. Are we still paying off debt? Are we trying to buy a house? Have we been able to max out our 401k accounts? How much do we want to spend on travel? In our case, once we figured out our objectives, paying off mortgages and saving for travel, then we could really map out how to get there.
We have had the “where do you want to be in 5 years” conversation dozens and dozens of times now. We know our answers might be different from what we see other people doing, but we like to talk about money and financial planning with our friends. Do you have student loans to pay off, are you planning for children, are you planning for known or unknown medical issues, do you want to buy a home, do you want to travel, do you want to move your family to a different state in the U.S., or to a different country?
We also know from our own experiences that when people in a relationship go through these exercises it’s common for each person to come at the concepts very differently. No one is a mind reader, or at least we are terrible mind readers. So when we need to communicate our vision to each other we make room for each person to approach topics from different directions, and we plan for a variety of visual tools that work for each person to make things more clear and more fun as we have our discussions.

I’m both an analytical and visual person. I can build a mean spreadsheet and I always think and process in 3D. This is due to my Dyslexic Thinking, a concept that is starting to be seen as having value rather than being simply a disability. The value of dyslexic thinking is being championed by Richard Branson, CEO of Virgin. He too is a fellow dyslexic.
The actor Orlando Bloom who is also dyslexic recently made a comment on a video produced by Made By Dyslexia that rings really true to me. He said, “If you’re dyslexic, its kind of your super power.” Now that I’m an adult and dyslexia is not as painful, I can appreciate that statement.
Since Ali and I know the complexity and the value of my dyslexic thinking, and Ali has her own process for planning, thinking, and comprehending, we always like to find as many ways as possible to represent and communicate the concepts and visions we are discussing with each other.
The following is a little chronicle of the processes Ali and I explored to come together to make the critical decisions for our FIRE plan. I hope you find a process that really speaks to YOU.
The Good, the Bad, and the Neutral
We have been making large and small financial decisions throughout our relationship with the understanding that we try to make the best choice at any given moment, even if we change our minds the very next day! Every major financial decision we make together goes through a “go/no-go” decision process (this is something Ali learned in her career that she brought home).
When I announced we had technically already hit FIRE in the summer of 2017, Ali wanted us to stop and figure out exactly how we got there. She was hoping I could point to something specific across our multiple accounts in one of my many spreadsheets, but frankly that seemed overwhelming to try to go back and identify. My money tracking system is pretty solid today, but it was nowhere near as detailed or closely tracked 15 years ago. So we agreed to go back to 2004 when we met and chart all of the bigger money choices we have made together as a couple since 2005.
We wanted a visual timeline where we rank our various choices as good, bad, or neutral. Ali is crazy about timeline graphics and used to create them for projects at work all the time. Over a weekend we put our financial decision timeline graphic together so we could see all of our big money choices and whether they sped up or slowed down the process of getting to FIRE. It’s almost like a heat map, and we love it. We really enjoy revisiting our earlier choices, with no judgment, knowing we feel different about them today since we are so much wiser now (hahahaha). We want to learn from the outcomes of past decisions and keep our eyes open as we make our future decisions. And we are looking forward to adding our 2019 decisions to the timeline this year!
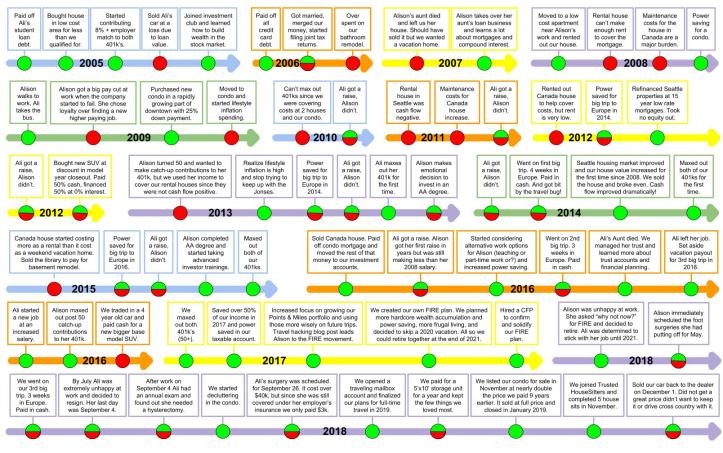
When we review our past financial decisions we inevitably get into discussions, again and again, about the two houses we tried to keep as rentals. The first one was the house we bought for ourselves in Seattle, which plummeted in value during the 2008 financial crisis, and we then kept as an unprofitable rental until the value came back up enough to sell it at break even. The second one was the house we inherited from my aunt in Canada after she died. I enjoyed that house as a kid and loved it as an adult. We decided to keep it even though it was in need of major repairs that became a financial burden for us, it was really too far for us to use it as a weekend home for ourselves, and it was not a good house to keep as a rental. Over time we learned that our choices in both of those cases were made from an emotional point of view rather than a wise money point of view. Those two houses were never good rentals or good investments. But we learned a lot through those experiences and we really loved and enjoyed them while we had them.
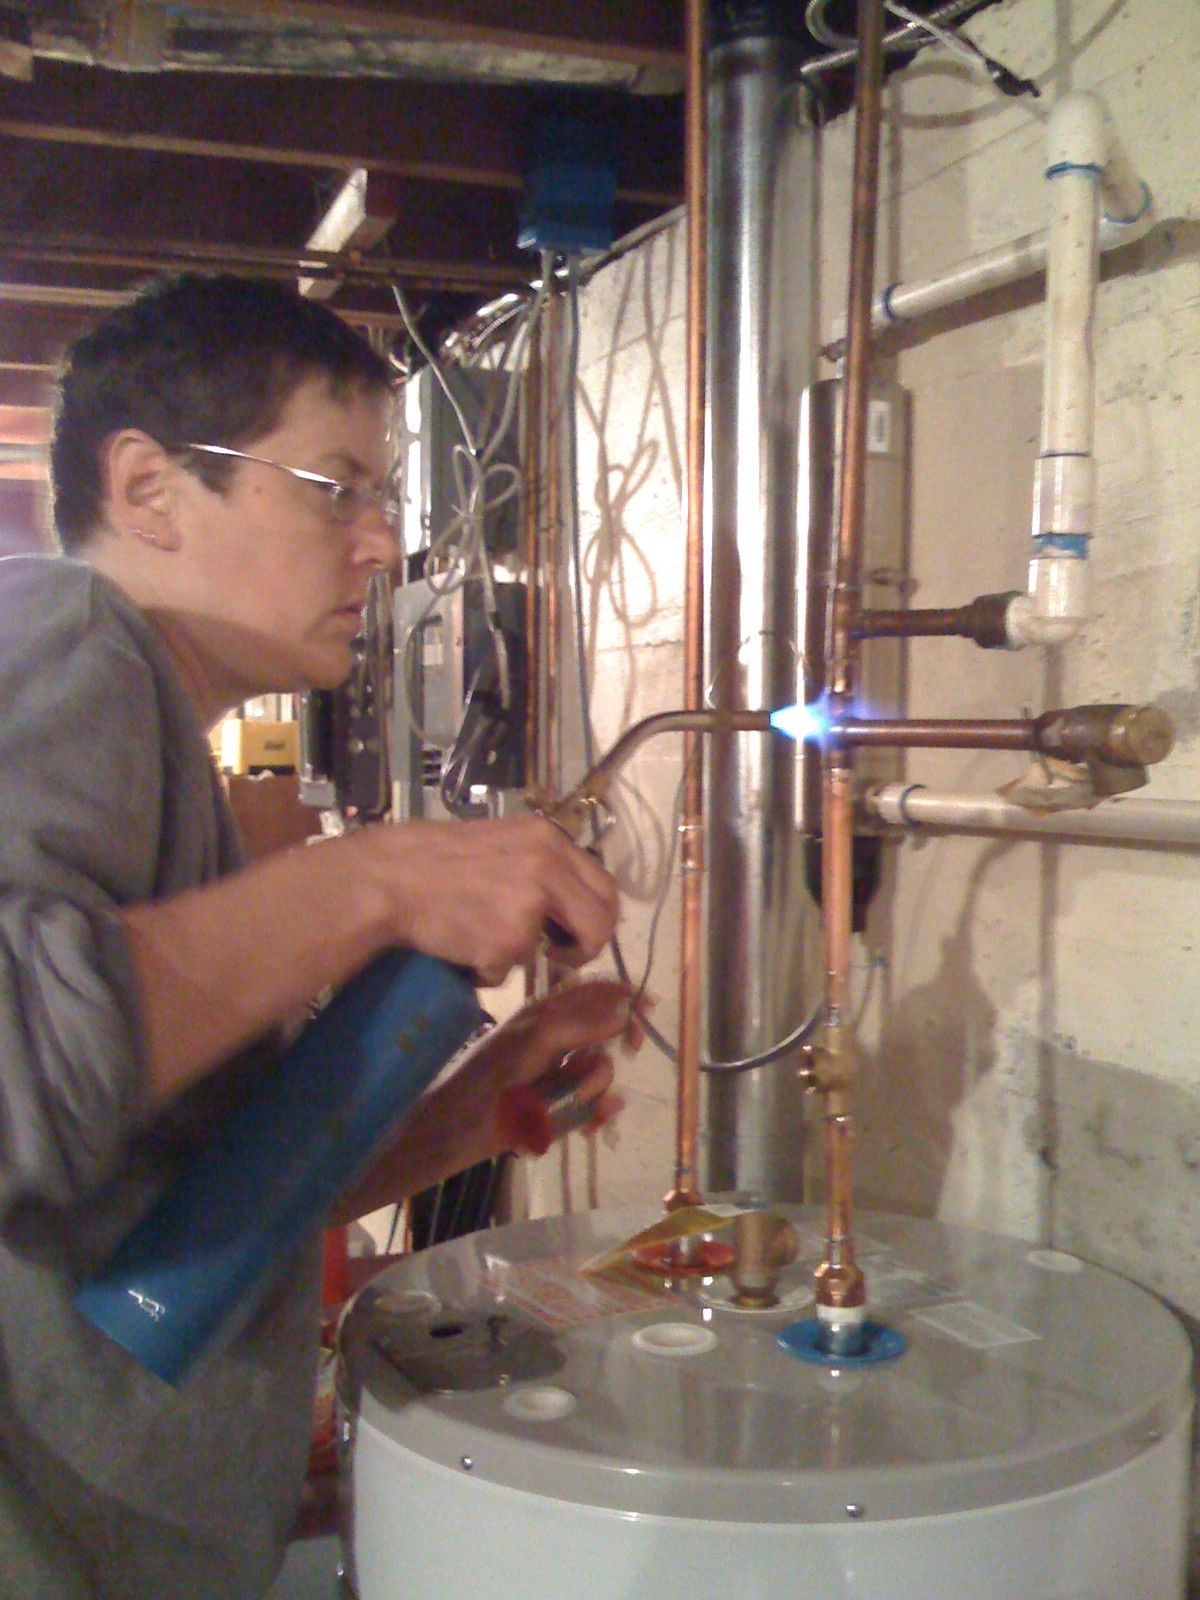
That’s Alison working on the plumbing at our house in Canada. 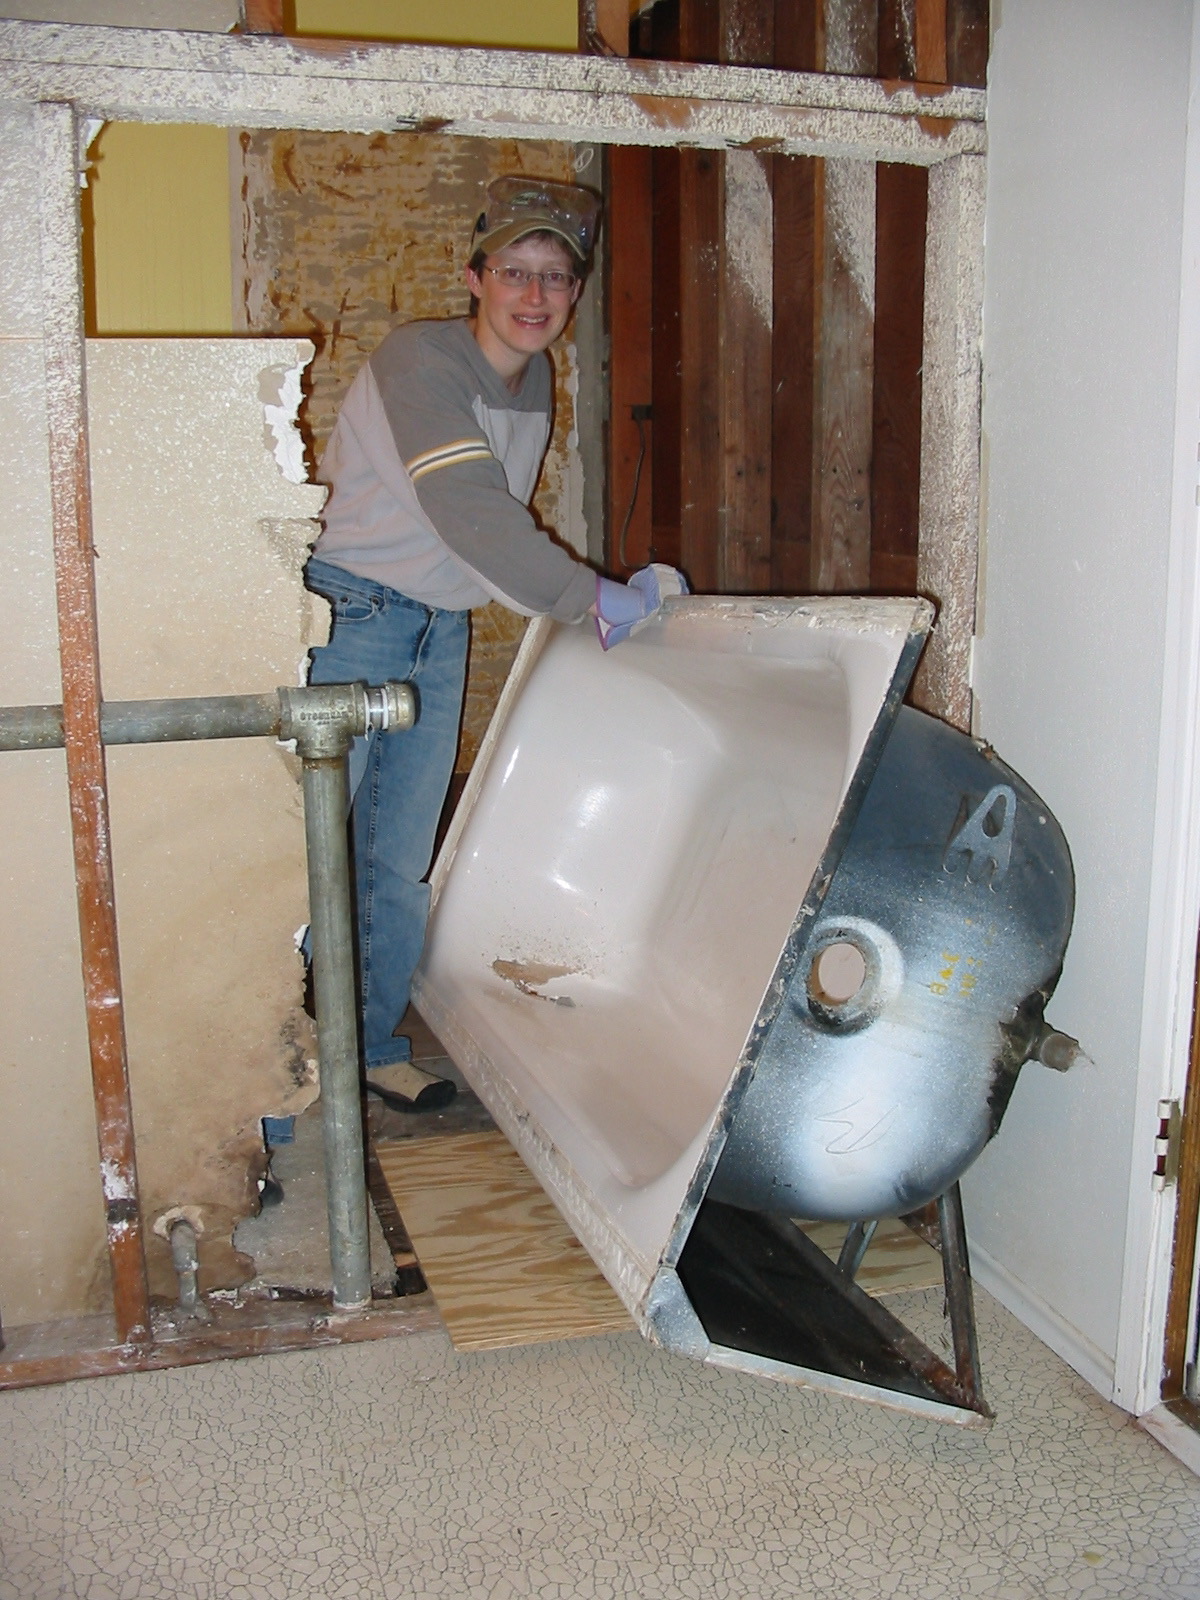
That’s Ali doing some bathroom demolition at our house in Seattle.
Identify Your “Givens”
Do We Have Enough?
Annual Expenses x 25 = Your (FIRE) Number
Note that the 25x concept is generic, and you should find your own safe withdrawal rate number, and make sure it really is safe for you. In a previous post, What’s Our Number?, we described our experience calculating our number to make sure we had enough net worth (assets less liabilities) invested to generate the passive income needed to cover our post-FIRE expenses. We determined we have about 33x our annual expenses invested for an approximate 3% safe withdrawal rate. That’s a number that we feel is safe for us.
Where Is Our Income Coming From?
We did not want to have to work part-time or have a side gig in order to start our FIRE journey. We have both been working hard for enough decades that we want a break from working for income. That means we needed our “Income Engine” (that’s my term for the way our money works on its own to create our income even though we have retired) to do the heavy lifting making the money we need to cover all of our expenses, forever. When building our income engine we asked ourselves what kind of FIRE experience we wanted to have. Do we want to manage “something” that would generate this income, like a rental home? Or do we want an income engine that truly takes minimal effort from us?
Tanja Hester, FIRE blogger extraordinaire at Our Next Life and author of “Work Optional,” writes in her book that there are 4 basic options for generating passive income with minimal effort. She calls it “magic money.”
- Drawdown Investing – Stocks or index funds that produce dividends, price appreciation, and original cost basis to sell or drawdown.
- Dividend Investing – Stocks or mutual funds that focus on preferred shares or other vehicles like REITs, allowing withdrawal of only dividends. In this case, the starting portfolio has to be higher so you don’t need to sell the underlying investments.
- Rental real estate investing – Rental real estate income, minus property manager fees.
- Passive business income generation – Build a business that generates passive income you can later sell and roll into one of the above options if desired.
Tanja Hester’s list is really helpful for understanding accessible passive income options for the average person reaching for FIRE. When we were narrowing down the options for our passive income engine, we knew unequivocally that we did not want to be landlords. We’ve been there, done that, and did not like it. We also considered buying into a business or building our own business, but we are not entrepreneurial types so that did not appeal to us. That left us with options for investing in the broader stock market.
Looking to a Stock Market Income Engine
Going back to Tanja Hester’s list, our options are either drawdown or dividend investing with low cost mutual funds or stocks. Since I have been investing in individual stocks for many years, I like the idea of being in the market from an informed position with minimal effort to produce a comfortable level of return through low cost mutual funds.
Another prominent voice in the FIRE community espousing investing in low cost index funds is JL Collins. His book, “The Simple Path to Wealth” provides a wonderful outline and introduction to using a few low cost anchor index funds to build the equity and fixed income (bond) portions of a portfolio. He makes it clear that all the low cost brokers (Vanguard, Fidelity, and Schwab to name a few) all have index funds that track the broader stock market, international, bond, and specialty funds one could possibly need to construct an income engine.
Drawdown or Dividend Investing?
When deciding between a drawdown strategy for income or an all dividend producing portfolio, we had to look at what kinds of accounts we had and how and when we can access each of them. Right now 60% of our portfolio is outside of tax advantaged or tax deferred accounts. A big chunk of that money came from selling our condo in Seattle at the end of 2018. See our 2018 Year End AOC Portfolio Report blog post. Selling our condo was the biggest decision we had to make to break loose that capital and add it to our income engine so it could start spinning off income immediately. To be frank, we knew we were in a freak scenario where the condo nearly doubled in value in 9 years and we wanted to take advantage of that growth and put that money to work in the market. As much as we loved our condo we decided we would rather sell it since it represented 10 years of living expenses. The other 40% of our portfolio is in either IRAs that were rolled over from our 401ks or Roth IRAs. Since we don’t have full access to our whole portfolio penalty-free, we can’t build a true dividend-focused income engine until I turn 59.5 years old. But that’s only 4 years away at the time that I’m writing this!
Explaining Our Plan…
In Words
We have built a portfolio in our taxable account that generates enough income in the form of dividends, as well as capital gains and original cost basis from selling funds, to cover our annual expenses. The dividend income also needs to stay within lower tax brackets (12% at the time of this post in 2019) so our capital gains tax will be 0%. In the near future, probably in 2020, we will also start converting portions of our rollover pretax IRAs into our Roth IRAs to reduce the amount of taxable required minimum distributions (RMDs) that we must start taking when we reach 70.5 years of age.
Although these rollovers will create a taxable event each year that we make that move, we will only convert enough to take our income up to the top of the lower income brackets (12%) while still keeping us at the 0% capital gains rate. By rolling these IRAs over now, we will save much more in taxes in the future.
Clear as mud, right? For information on Roth conversions and more, see the Mad Fientist’s post called “How to Access your Retirement Funds Early.”
Side Note – Interviewing CPAs
Since we were going to be traveling longterm, I wanted to start out with a local CPA that could help us navigate that part of our new plan. I interviewed 3 CPAs and decided they had to understand our goals and motivations to be the right fit for us. It was my canary-in-a-coal-mine test. Our plan includes qualifying for ACA subsidies, which helped winnow the CPA field. That part of our plan reads like this: The amount of dividend, capital gains income, and Roth conversion we choose to create will be held below the 4x poverty rate to allow us to qualify for ACA subsidies. That idea stumped all but one of the CPAs. The first two CPAs said they had never seen anyone try to manufacture a low income before and didn’t get why I would be interested in doing that. The third one, the CPA we hired, said “I love it, great plan! Yes I can absolutely help you with that!” And I have really appreciated having his input.
In Numbers and Pictures
Since our FIRE plan lived in my head in numbers and pictures, I was compelled to flesh it out in as many forms as I could. Trying to find a way to explain the concepts in my head is like trying to navigate from one location to another in the car. Do you need the line by line directions printed? Can you just look at the little line that’s drawn on a Google Map and commit that to memory? Or do you need Google to call out each turn visually and audibly? I do best with the overall image of a map and I can usually tell if we’ve made a wrong turn. Ali likes the turn by turn directions, but no audio prompts. Everyone is different!
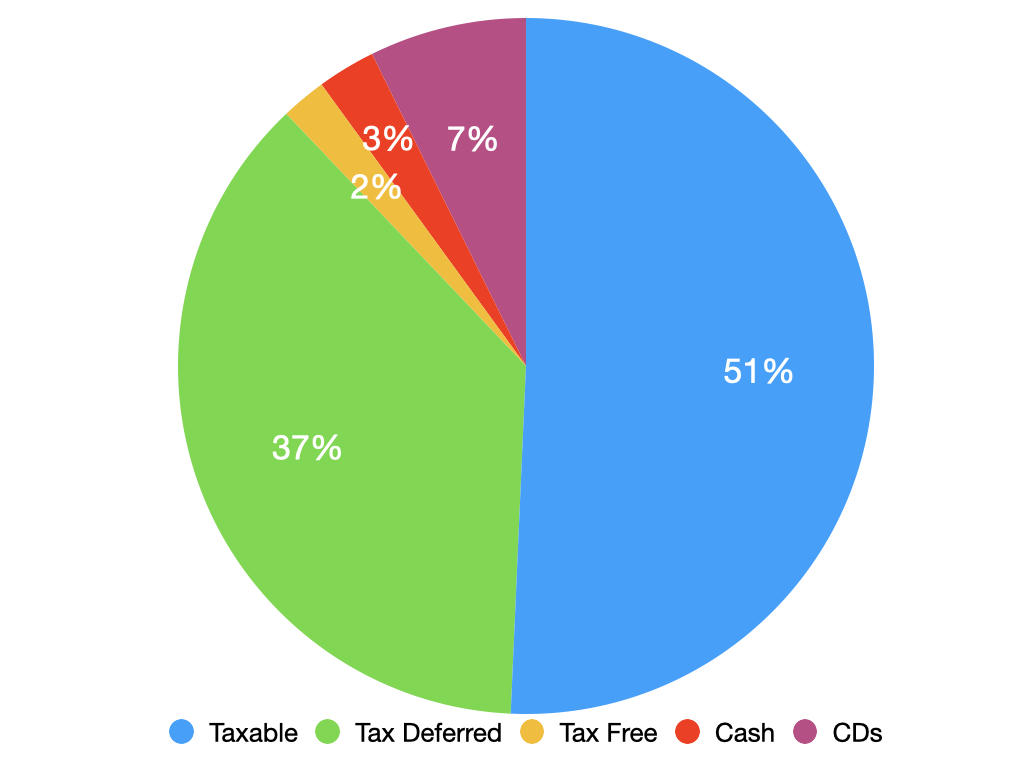
Over the years we had consolidated all of our accounts into one institution, Schwab. That made it easy for me to track down actual numbers and build the following spreadsheet to paint a numeric picture of our drawdown strategy. The spreadsheet below and the pie chart above are two very different ways to illustrate the fact that quite a lot of our money is currently held in inaccessible tax sheltered accounts.

The purpose of this spreadsheet is to math-out the plan I described in words above. Basically, we want to live off our taxable account while we convert the tax deferred side and let it grow. The spreadsheet has room for all of the data we need to “math this shit up” as FIRECracker at the Millennial Revolution likes to say.
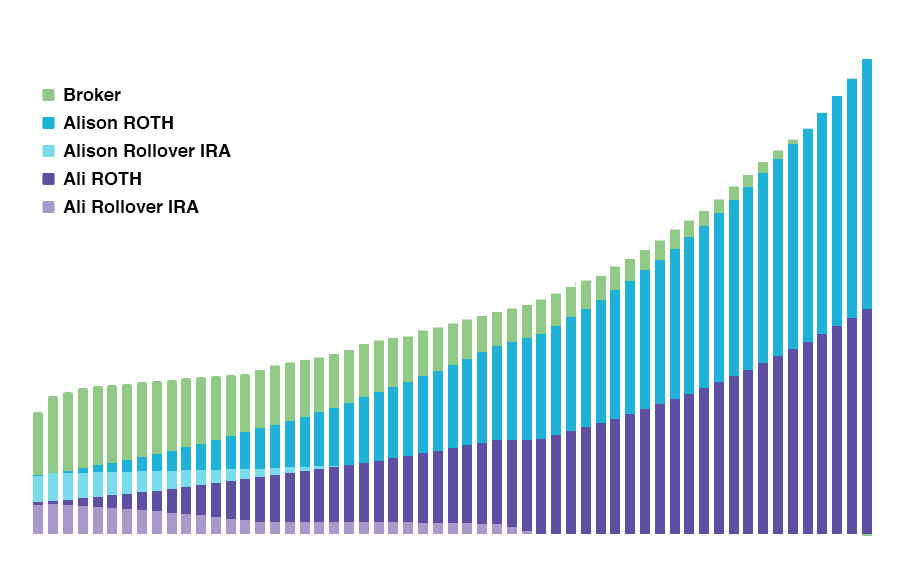
The Power of Bar Charts!
In the chart below, the green is our taxable brokerage account being drawn down over time. The light blue and light purple are rollover IRAs that are each getting smaller over time as we convert them. The dark blue and dark purple are Roth IRAs that grow larger as we convert the IRAs. I turn 70.5 much sooner than Ali (as I’m writing this post I’m 55.5 and Ali is about to turn 45) so I will convert my IRA to a Roth faster to avoid big RMDs.
But That’s Not All Of It
We have also created some fun flow chart graphics for visual pictures of our money coming together to feed our income engine. During my career I used to map out the company’s production workflows while I ran an image retouching department. I think flowcharts are a great way to check the progression of a project so that we don’t miss any steps. They also help us imagine how everything fits together.
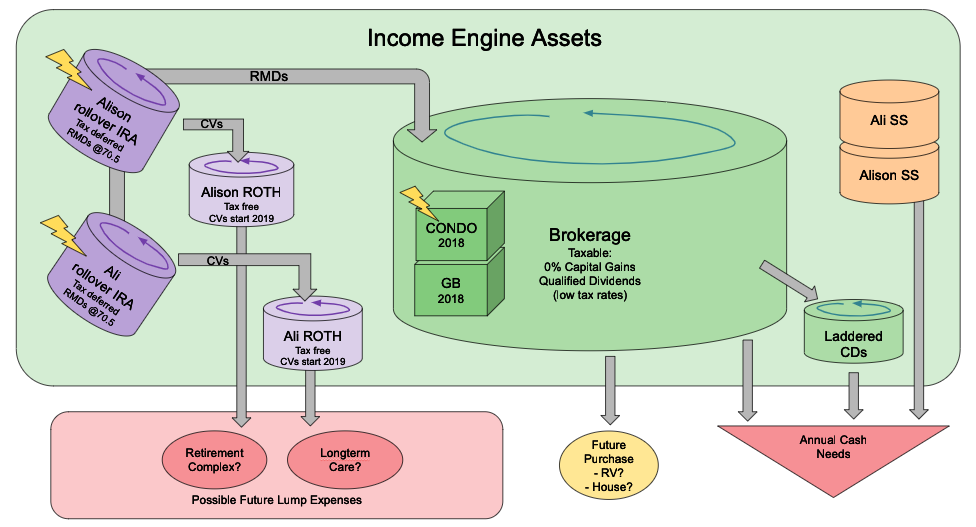
Right now, current cash flow needs come from the taxable account while IRA conversions happen off to the side. At some point, RMDs will flow back into the taxable account. There are also some laddered CDs in the system to draw from should there be a prolonged down market. We will also draw from IRAs or Roth IRAs should we need longterm care or want to buy into a retirement community at some point. And hopefully some social security will kick in at a future date.
Do you SEE what I’m Saying?
While searching for inspiration I came across an article from The Million Dollar Mama on creative ways to use the well-known bullet journal technique to help motivate people to set and track money goals. It’s very visual and colorful. I used that technique for a time and enjoyed it. Below is my digital graphic novel version of our income engine flow chart. Yep, we have two versions of this to enjoy right now!
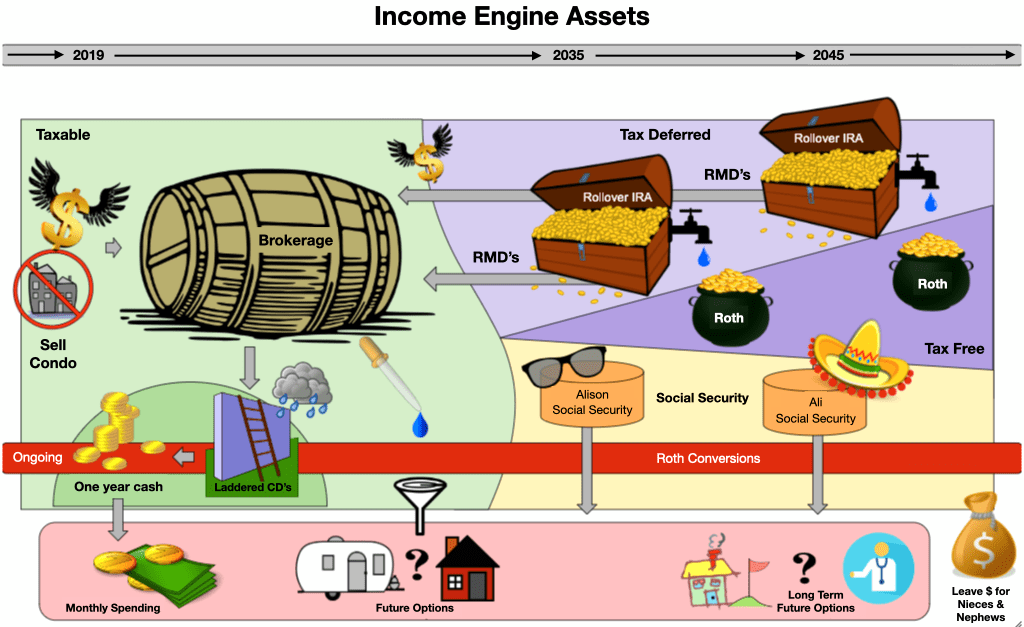
Working from left to right along the timeline in this graphic I break down our income engine assets into taxable, tax deferred, tax free and social security. At the bottom I have a red bar indicating ongoing money movement. Again, it all flows in and out of the brokerage account. Our condo money was freed up to start working for us right away. We have some laddered CDs to protect us from a prolonged down market. The taxable broker account feeds our current spending needs and can be tapped for further options (maybe an RV and later a home). Moving over to the tax deferred side, the rollover IRAs start getting converted right away into Roth IRAs to reduce the RMDs we have to start taking when we turn 70.5. When we start taking RMDs, that money will flow back into the brokerage account and get either reinvested or used for expenses depending on our needs. I start taking social security around 2035 and Ali around 2045. The bottom section of the clip art graphic shows possible future expenses like a retirement home or longterm care. In the end we’d like to have enough left to leave some money to our family and some charities.
What’s fun is there is a medium for everyone, or multiple mediums if you are like us. There are tons of options that are digital or pen and paper!
The End – For Now
If you don’t feel like you have the right tools to visualize your ideas and goals, find something else. It’s important to find the tools that are right for you, that help you identify and communicate your own ideas and goals. And if you are in a relationship it’s also very important that you each have the right tools to clearly share ideas and goals with your partner, especially if you have different thoughts to convey. Ali and I are always on a mission to use the best forms of communication, and more is always better for us.
And on a completely different track, we always have our best and clearest conversations when we’re on a hike or a long walk. We call them our “walk and talks,” and our ideas always flow during the walk, and when we get home we are full of ideas to draw out and brainstorm some more. When we had our condo in Seattle we always had oversized 25”x30” adhesive sheets on the wall and our dry erase board covered with ideas. Now that we are on the road we take notes on hotel mirrors with our dry erase pen. Then we can each go back to our note pads and other tools. I will inevitably be fiddling with various spreadsheets, bar charts, and other graphics to ensure we are implementing our shared vision.
Please feel free to share your feedback! I am always interested in hearing about other peoples’ unique super powers for communication, whether that’s at work, at home, for your own use, or with your partner!

Loved this post! May I just say, Alison, you look sensational for your age! I thought you were in your 40s!
Unsure if you intentionally blurred it like the spreadsheet, but the heat map/timeline is very hard to read and it’s blurry when zoomed in. Any chance of seeing an unblurred version?
LikeLike
Haha – Everyone in Alison’s family looks young! Maybe their age genes are stretched out like their leg bones. LOL. As for the timeline graphic I have added in a PDF version that you can download. Enjoy!
LikeLike
[…] are available to dip into and enjoy anytime we need to cool off. See our Money Crush post, “Visualizing Your Money” for more detail on our full flow of […]
LikeLike
[…] This is where we explain HOW we plan to invest. For more detail on our passive Income Engine plan, see our blog post “Visualizing Your Money.” […]
LikeLike
[…] three-fund portfolio. For more information about our portfolio you can check out our blog: Visualizing Your Money, and Avoiding The RMD […]
LikeLiked by 1 person
[…] We’ve all played that game, “What would you do if you won the Lotto?” We had fun playing that game to make sure there were no rules when we brainstormed our dream life after retirement. Once we decided to sell our condo we wanted to map out as many new ideas as possible for where we might go next. Once again we turned to our family mantra, All Options Considered, and went back to the white board. […]
LikeLike
[…] when we have planning sessions about money and life. We also think creating graphics like these for visualizing your money, can make financial conversations more interesting and successful for people. These exercises can […]
LikeLike
Ali,
I LOVE your visuals!! Would you mind sharing what programs you used for the various graphics? For the decision timeline, what program did you use? For the bar chart, was it in excel? how did you make it extrapolate out your plan?
Thanks!
LikeLiked by 1 person
Hey! We’ve been using Google Docs for everything. And I do mean everything. There are some fun but basic drawing tools that Ali uses for the timeline and things like that.
I have been really impressed with Google sheets. The more I dig into the tools there, the more I find. If you look at our 2019 reports or the RMD Cliff post, all of that was done in Google Sheets.
I’m happy to answer any specific questions if you see a particular graphic you want to know more about. Just let me know!
Cheers,
Alison
LikeLike
Really like the idea of tracking annual milestones! These days I can’t really remember when we merged finances or paid off credit card debt– now I wish I had that info on our money history.
LikeLike
It took us several times to go back and add all the big mile stones. But it did help us see that even with some not so good choices we still managed to FIRE!
LikeLike
[…] a process of gathering facts, data, and information. No more and no less, and no judgement! See our Visualizing Your Money post where we talk about our money decisions timeline […]
LikeLike
[…] post-FIRE budget. It allows us to be very generous with our giving plan. It reminds us to be in constant communication with one another so we can stay on the same page and each get what we need as individuals. It helps […]
LikeLiked by 1 person
[…] budget. It allows us to be very generous with our giving plan. It reminds us to be in constant communication with one another so we can stay on the same page and each get what we need as individuals. It […]
LikeLike
Is it correct to deduce from your bar graph that the Roth contributions during the working years were minimal? If so, what reasoning went into using traditional IRAs over Roth IRAs? Since I haven’t thought too much about the endgame for the retirement funds, I’ve been choosing Roth for the IRA since the 401k plan does not provide a Roth option.
LikeLiked by 1 person
In our case, the graph for today shows that all our 401ks have been rolled into IRAs at this point and we did spend more years focused on IRAs than Roths. BUT if I had it to do over, after maxing out our 401ks I would have put any extra money into Roths instead of traditional IRAs. Then once we maxed out Roths, we would finally invest more in our brokerage account. It worked out well though since the brokerage is where all our living expenses come from and we have full access to that now and we can’t access our IRAs or Roths since neither of us is 59 yet.
LikeLike
[…] It might seem confusing at first but it’s a good thing that buckets can include funds from multiple accounts, and each of your real life accounts can fund multiple buckets. Buckets aren’t formal in the same way accounts are, they’re really just another way to visualize your money and your plans. […]
LikeLike
[…] I think spreadsheets are the best! But we are very visual people and we also like to use all sorts of charts and images to help us communicate our thoughts, even […]
LikeLike