
Last December we gathered in Arizona with family to celebrate the holidays and swapped names for a simple gift exchange. That worked great for me and Ali since we aren’t into buying mountains of presents to stick under a tree. We picked one person to be the Master of Gifts who would assign each of us with one person we could give to, and we all made a list of 3 gift ideas we were interested in. My list had two practical ideas for projects at the house and one book, the Retirement Planning Guidebook by Wade Pfau. Yeah, I’m a money nerd.
And lucky me, my secret santa gave me a cargo net for our utility trailer and Pfau’s book! Yippee!
We are not certified financial professionals, nothing we discuss is professional advice. This post contains affiliate links. For more information please read our Disclaimer.
Last year Pfau published the Retirement Planning Guidebook, which condenses in one handy book many of the main topics retirees need to understand in order to make their own plans for retirement. Those topics include retirement risks, sustainable spending from investments, annuities and risk pooling, medicare and health insurance, just to mention a few. The more topics the better since figuring out how much you can spend in retirement is about much more than just the 4% rule.
This book is packed with so much retirement related information that really it’s a beast! It’s 462 pages long with 13 info packed chapters, and it’s written in a way that seemed both accessible and informative for us. And each chapter ends with a helpful checklist of all the main topics one should address and follow up with as well. The Retirement Planning Guidebook isn’t a quick read or a light read, but it’s so useful and informative that I’m giving it to my sisters this year because I think it can make the retirement process easier.
For people who do want to read this book we want to explain what we liked about it and why we want to share it with others. And for people who don’t want to read this book we want to pick out a few golden nuggets to share. Reading the Retirement Planning Guidebook isn’t like reading the Psychology of Money, which we loved and reviewed a couple years ago. This book is more like taking a high level personal finance class which is fun for some people but definitely not fun for everyone. I personally loved gathering new data and really enjoyed the chance to learn more about spending in retirement at my own pace with this book. Though I have to admit I wanted to poke myself in the eye while reading the chapter on annuities.
What I really loved about the way Pfau covers topics is that he presents both sides without really pushing people in a particular direction. To be clear, Pfau is basically running a retirement related business so he definitely has opinions and services to sell. But this book is not filled with pointed opinions. This isn’t a book that tries to tell others what they should or shouldn’t do, which is refreshing and that’s what makes it easy for us to recommend.
Pfau doesn’t say you should only invest in equities, or you should never buy an annuity, or you should have some kind of life insurance in your plan. His examinations and explanations are in depth and neutral. And after reading this book I can better understand why some folks choose things like annuities or whole life insurance when they are risk averse and why those options help some people sleep better at night.
I also like that you don’t have to read this book in order, though I know some analytical folks will want to do that. By now I’ve read the entire book multiple times but I started with Chapter 4: Sustainable Spending from Investments, then jumped back to Chapter 1: Retirement Income Styles and Decisions, and I kept bouncing around from there. You can tackle this book in whatever way works for you.
Ali finished reading this book and declared it was exactly what we needed back in 2017 as we were preparing to retire. But I don’t think I would have been ready to take on this book if I had found it back then since I was already experiencing information overload and feeling nervous about taking the retirement leap in 2018. It covers so many important retirement topics so thoroughly that I might have felt overwhelmed as if I was reading the entire Encyclopedia Britannica and preparing for a test without enough time to do the homework. Maybe if I had found it back in 2014 when we first found the FIRE movement it could have helped us accelerate our process? Who knows, I’m just glad to have this book today.
Whether you’re new to retirement planning, or already retired like us, or anywhere in between, you can read this book front to back or just use the index like it’s an encyclopedia to look up topics of interest. I know from experience you can have a great time flipping back and forth discovering things you never thought you needed to know, and new levels of detail on things you thought you already knew. And that’s why I want to share this book with others!
Since it’s so detailed I’ve decided not to do an in depth review of each chapter. Instead I’m picking out a few topics that come up in most of our money conversations with other retirees. These are also topics I had been craving more information on myself and this review series is a great reason to build new spreadsheets and get more conversations going. And I did build a new spreadsheet that I’m sharing in this post!
In this first post in the series I’ve covered Part 1, RISA Profiles and the Funded Ratio. RISA profiles are covered in Chapter 1 of this book and the Funded Ratio is covered in Chapter 3. Knowing your RISA style can help you start thinking about the retirement strategy that’s best for you. The Funded Ratio is a present value calculation to see if your money can fund your expected budget, health care, and unexpected spending as of today.
In the other two upcoming posts in this book review series I’ll cover:
Part 2, Front Loading Taxes. This is one of our favorite topics because we are very focused on front loading our taxes. But we’ve run enough spreadsheets for other people to know that doesn’t make sense for everyone. Would it make sense for you to pay more taxes now to reduce your lifetime tax obligation?
Part 3, Building a Later in Life No-Go Budget. I wouldn’t call this a favorite topic since it’s not the most fun thing to plan for, but it’s definitely at the top of our list of important phases to plan for in retirement. How does your budget change when you’re elderly? And how might it change if one spouse needs a higher level of support for a few years, which is often categorized as Long Term Care and includes things like skilled nursing, assisted living, or home health care?
Ok let’s dive into this first post in our series!
1. Retirement Income Style Awareness (RISA)
Hey folks, they say it helps to Know Thyself, so check your risk profile!
Have you ever been asked by your 401k administrator or some other financial person, “How do you feel about risk?” Usually, they’re expecting you to say something like, “I’m very nervous about the stock market” or “I love risk and I base jump in my spare time.” These questions always seemed so basic and never, to me at least, informative or helpful. I always wanted to understand why they wanted to know and what they were going to do with my response.
In Chapter 1, Pfau introduces a risk assessment tool called the Retirement Income Style Awareness profile (RISA), one of the tools offered by the Retirement Researcher Academy run by Pfau and his colleague Alex Murguia. We have not joined this paid community ourselves, but if you do buy the book Pfau offers a link in Chapter 1 to take a free RISA test.
Pfau describes in the book that people can build a better retirement plan if they have a more in depth understanding of their comfort level with investing risk and that’s what the RISA is all about. We both thought this assessment tool was interesting and fun to take, and it reminded Ali of the social style tests she ran for her teams back when we were still working in our careers.
This assessment process involves answering a series of questions that will map your profile in the matrix shown below. The four quadrants compare your emotional need for safety or avoiding risk, to your preference for more or less aggressive investing. The assessment also measures your preference for managing your own investments, or having advisors help you, or having advisors fully managing your money. Another part of the assessment is rating your preference for committing to a plan or maintaining more flexibility to change your plan.

As shown below, there are 4 income awareness styles the assessment can categorize you into: Time Segmentation, Income Protection, Risk Wrap, and Total Return. Your RISA profile shows which quadrant you fit in, suggests the investment style you are more comfortable with, and gives you a bunch of snapshots about your retirement income concerns and goals.

When we took the RISA test we assumed we could end up in slightly different zones within the same quadrant, but in our case we both fit in the upper right corner of the Total Return Approach quadrant. And that’s good news because that makes it easier for us to stay on the same page with our personal finance strategy. We’re glad for some extra confirmation that we’re still there after spending 18 years talking, listening, and compromising with each other (and after 4 years of retirement).
Taking this test ourselves helped reinforce the idea that Ali and I really are more comfortable relying on stock market growth and dividend income for our retirement income. We aren’t just compromising and secretly worrying.
And a reminder, everyone is different and there are no right or wrong answers here. We all need to build the strategy that works best for our unique styles, wants and needs.
Our personal RISA profiles indicated a Total Return Approach to retirement income, which means we are both comfortable relying on withdrawals from our passive investment portfolio to cover our retirement income needs. Which really means we aren’t afraid of investing and we aren’t afraid of keeping our money in the stock market where it will shrink and grow during the normal ups and downs of the market. Our profiles confirm that we are not focused on creating contractual income in retirement through annuities or even relying 100% on full Social Security to make our numbers work. We also don’t want a bond-heavy portfolio (our current allocation is 80/20 even though we’re all experiencing a rough bear market year). We do believe the US stock market is one of the strongest in the world and we know it will have its rough patches like we’re seeing right now. We trust that the markets will recover in time. Ali and I are generally conservative optimists when it comes to our money.
The graphic below shows a snapshot from my RISA profile with mention of my response for Safety vs Probability. The result was that I strongly prefer Probability with market investments as described above, and I do not prefer a Safety-First approach. Regarding Optionality vs Commitment I strongly prefer Optionality, which means I prefer retirement income solutions with a high degree of flexibility because I want the ability to reassess our plan as needed when our personal needs change or the economic environment changes. Ali had the same results for these elements.

Of course Ali and I are not identical and we did get some slightly different results in a few categories including Lifestyle, shown below with my result on the left and Ali’s on the right. Ali is a bit more concerned about her ability to enjoy retirement, which means she really does not want to be overly conservative with spending to the point where she might miss out on fun during retirement. Whereas I’m a bit more willing to trim spending than she is, even if it means missing out on some fun things we could do in retirement. Getting this confirmation was really helpful for us as a couple and this result gives us an area to keep discussing in the future.


After reading our complete profile results we found them to be quite useful since we choose to be DIY investors and we’re always talking about things like our equity to bond ratio, which is very strongly tied to our risk tolerance.
If you’ve taken tests like this before, such as the People Styles assessments Ali used during her career, or any of the other personality assessments out there, you’ll understand why we think the RISA is interesting. For another source reviewing the RISA framework and quadrant system check out this great article from Michael Kitces.
So it’s clear for us here at AOC that we live in Probability mode with our retirement plan. We’re willing to trust that the stock market will grow based somewhat on its historical performance and also based on our experience as investors in the stock market over the years. For many people trusting the market can feel too risky, hence its counterpart in Pfau’s book, the Safety First approach and strategy of allocating more of one’s net worth to contractual income sources like annuities. We know lots of people who want more of a Safety First approach in their retirement strategy because that’s what works for them. We are all unique!
2. The Funded Ratio
I love spreadsheets and want to try new calculators whenever I can. Especially when they allow for lots of variables, ways to enter data, and a willingness to change our assumptions. Pfau’s Funded Ratio is a gem in this book, and it’s the latest shiny object I’m obsessed with. With the Funded Ratio you can input data that’s similar to what we’ve added to our own calculators like investment balances, estimated Social Security, and our estimated budget. But the Funded Ratio calculator takes more of the guessing game out of the equation by using a Present Value approach.
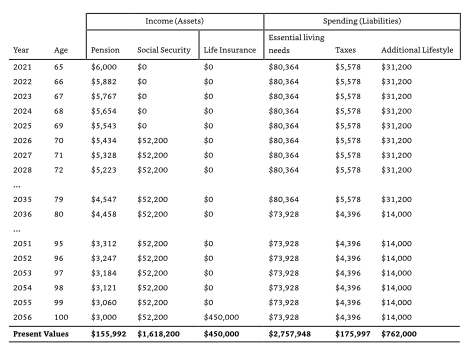
Retirement Balance Sheet
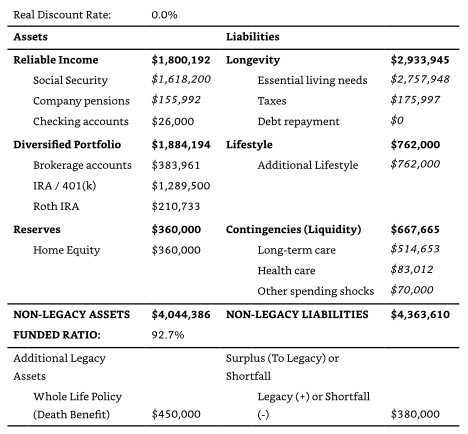
This new-to-us Funded Ratio calculator is covered in Chapter 3: Quantifying Goals and Assessing Preparedness. The end result of working through the Funded Ratio process is a percentage, a figure for how much of your liabilities will be covered by your assets based on your Present Value numbers. This process helps you evaluate your retirement cash flow with budget and spending goals, guaranteed income streams (like Social Security and annuity income), current assets, and current liabilities. It also helps you identify potential spending shocks that might interrupt your plans. You build a Retirement Balance Sheet that includes all of your assets and liabilities with their present values, and end up with a Retirement Cash Flow table like the one pictured below. In this table Pfau shows a 35 year retirement.
Calculating the Future with Present Values
Present Value calculations can be tricky business to understand. In the Retirement Balance Sheet shown above we can see some values staying the same and others reducing over time. Why? When it comes to spending it’s assumed that we’ll have the same buying power in the future as we do today, so the dollar value remains the same as a Present Value number.
Now have a look at Social Security in the table above and note that those values also stay the same. Social Security does increase over time as it gets a cost of living amount (COLA) increase every few years, but in theory the buying power of Social Security dollars remains the same over time. COLA increases happen at the whim of the government and they don’t necessarily stay in lock step with inflation.
Now look at the Pension column in the table above and note that those values reduce over time. That’s because most pensions are not inflation protected. So the amount of things you can buy with those pension dollars reduces over time as the cost of goods goes up with inflation.
Next look back up there at the various numbers under the Spending title. It’s assumed that people would willingly increase their spending budget as the cost of goods goes up with inflation. Thus your theoretical buying power is the same in the future as it is today. But note the reduction for all 3 columns in spending at age 80. Those reduced numbers are the result of Age Banding, which assumes spending goes down as we reach “old age” and move past our Go-Go and Slow-Go phases of life and into the No-Go years. For most people as you get older you spend less when you tend not to get out and about as much.
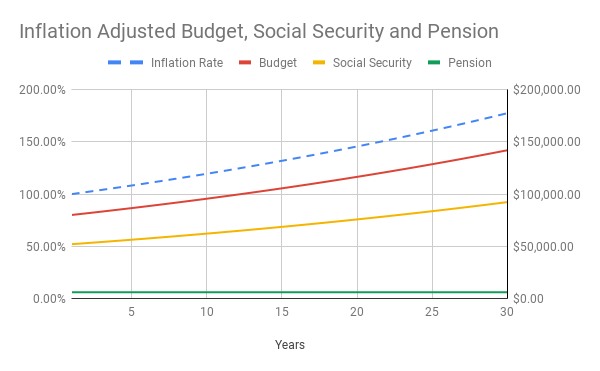
This next graph below is from our personal AOC spreadsheet. This was built with a probabilistic 2% inflation rate applied to the budget and Social Security, and it does not include Age Banding. Since most pensions are not inflation adjusted the nominal dollar value of the pension stays consistent over time. The Inflation line starts at 100%, representing 100% of your Present Value. To achieve the same buying power with inflation over time we will have to increase our budget to buy the same goods at higher prices in the future.
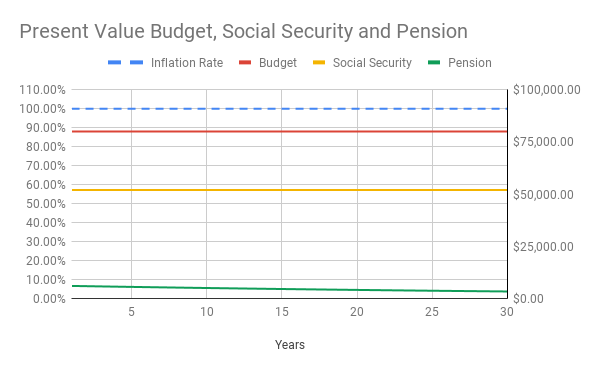
In the next graph below, which is also from our personal AOC spreadsheet, the inflation line is steady at 100% indicating no inflation is applied. The budget and Social Security lines also remain steady indicating they will maintain their same buying power in today’s dollars since these are in Present Value. However, the pension line gradually dives down, losing its value and buying power over time. After 25 years you can see the value of the pension and its ability to buy the same goods has been reduced because it’s not inflation adjusted. Clear as mud?
For more information on how Present Value is calculated, check out this video from the Khan Academy. We are big fans of the accessibility and style of the Khan Academy videos we’ve watched on tons of different topics.
Discount Rate
Once you complete your Retirement Balance Sheet your cash flow values are moved into the Funded Ratio calculation. What I love about this calculator is that it uses a very conservative Discount Rate or a “risk free rate” when evaluating future growth. Using a Discount Rate that’s similar to a risk free rate, instead of just using a historic stock market return rate, gives you a theoretical guaranteed rate of return. Note that with Pfau’s process you basically get to pick a Discount Rate number out of a hat, so if you go that route hopefully you’re using a thoughtful and well researched hat to pick from. But remember a high or low return rate is neither good nor bad, it’s just data to help you compare one calculation to another.
As an example and definitely not advice, when doing our own calculations in our AOC spreadsheet we always use a Discount Rate of 0%, along with a non-inflation adjusted Nominal Rate of 6%. Since the current historical annual return for the S&P 500 is a nominal rate of 11.88%, our 6% rate feels perfectly conservative for our own portfolio calculations.
Pfau discusses using a 0% Discount Rate, or a rate representing a guaranteed rate of return like Treasury Inflation Protected Securities (TIPS). Sticking with a 0% Discount Rate is wise since TIPS has a long term average rate of 1.89%. And since we’re in such a high inflation period right now with the current long term average inflation rate of 2.11% as I write this post, sticking with a Discount Rate of 0% is definitely prudent.
For clarification, here’s a quick overview of various Return Rates including the Discount Rate with a bit of description in a nutshell…
- Discount Rate = Rate used to convert a future payment back to its Present Value
- Nominal Rate = Rate of return without inflation
- Real Rate = Rate of return less inflation
- Risk Free Rate = Rate of returned guaranteed by the government (TIPS)
Calculating your retirement assets and liabilities with a 0% Discount Rate will show how much of your current assets and future cash flow will cover your liabilities. And that will show how well funded your retirement years are, knowing the closer to a 100% Funded Ratio you are the better. If you are below 100% funded, you can decide whether to work a few more years to earn more income, or ratchet up your savings rate while working, or both. If you’re over 100% funded, depending on how much over you are and what your risk tolerance is, you might even quit and retire a bit earlier than planned like we did.
In the table below, Pfau compares the total Present Value of assets and liabilities as well as some additional expenses he suggests we should consider to find the Funded Ratio result. In this example table from Pfau the Funded Ratio is 92.7%, which could mean you have a bit more to save or that you know your investments are safe and will produce a return over and above the 0% Discount Rate.
We really appreciate having a new way to look at the money we have coming in. Some people will get through this process feeling energized and probably lots of people will be a bit tired at the end. I was energized and Ali was tired at the end. I’m sure there are easier ways to explain the Funded Ratio concept compared to how Pfau does it. But if you can stick with it, all of these concepts, including the Discount Rate and Funded Ratio, will be demystified. And that’s what we’re always looking for in a personal finance book!
The most powerful thing about the Funded Ratio calculation is that it takes growth rates completely out of the picture by using a 0% Discount Rate. Removing the common tendency people have to be either overly optimistic or pessimistic about growth is a good thing. Converting your predicted future cash flows from contracted sources like Social Security and annuities into a total lump asset, then adding your current savings and investments divided by your expected health care costs and other expenses, will make it very clear if you do or do not have enough funds to fully fund your retirement today.
Every Good Calculator Needs an Equally Good Spreadsheet
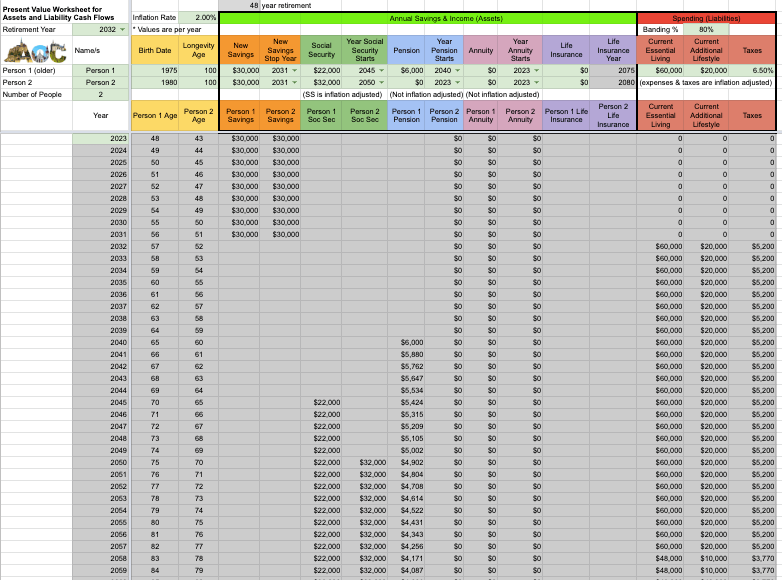
As I read about the Funded Ratio in this book I immediately wanted to build a new spreadsheet with a calculator so I could tweak a few things. I wanted to see how we might use Pfau’s ideas for our own planning and for coaching others as well. I’m excited to share this new spreadsheet tool below, the AOC Funded Ratio Calculator. Feel free to download and play with it yourself!
Download the New AOC Funded Ratio Calculator Here
Note about this spreadsheet: The file is a Google Sheet. You have to open it, make a copy, save it to your own Google Drive, and then you can add your own data in the green fields. Enjoy!
The AOC Funded Ratio Calculator
In our new spreadsheet I’ve added the ability to run the numbers for one person or two people. This helps for lots of reasons, including when couples run the numbers for long term care costs in the types of scenarios Pfau mentions. For example, it’s interesting to calculate the possibility that the first partner might have a shorter “long term care” timeframe with the second partner having an average long term care timeframe.
Additionally, based on Pfau’s discussion of Longevity Risk I’ve added the ability to enter your own life expectancy age. Pfau suggests estimating at least 100 years old as most people are living longer these days, and that works for lots of people including Ali. But we’ve learned through our coaching sessions with other people that it’s not uncommon for folks to want to add a more thoughtful estimate for the age they will reach based on their actual health, known medical conditions, and family history.
I’ve also added the ability to include new money you plan to save after today if you don’t intend to retire for a while since you don’t need to be moments away from retirement in order to benefit from this process. And we want to encourage people to start building their plans well before you’re ready to retire since that will allow you to make decisions about how much you need to save each year before quitting your job.
And just like we have in our other spreadsheets I’ve made it possible for you to add different values and starting years for things like Social Security, pension, and annuity income. And as I write this post I can already see the next thing I’ll probably want to tweak in the new spreadsheet, which is the ability to add a dedicated number for rental income since so many of the people we coach about money want to include their rental income in a separate field.
In our new tool I also built a very simplistic Age Banding function for the expected budget. Pfau’s balance sheet drops the budget down to 80% of its Present Value when you turn 80. We drop it down to 80% as well, but in the case of two people I’ve set this tool to make that drop when the average age for a couple is 80, because lots of couples are not the same age (we’re almost 11 years apart). You can also adjust that 80% number up or down if you’d like. Additionally, you can set a global retirement year that’s triggered when you would start drawing your annual expenses from your assets. We love being able to control those kinds of variables in our calculations.
Present Value Worksheet
The Present Value Worksheet in our spreadsheet is very similar to Pfau’s, with a few exceptions. For now I’ve set our tool so you can only enter a 0% Discount Rate, though it’s possible we will consider adding the ability to change that figure as well. But I’ve intentionally built it with a 0% Discount Rate because I want to remove our natural human tendencies to over or under estimate future growth.
Funded Ratio Worksheet
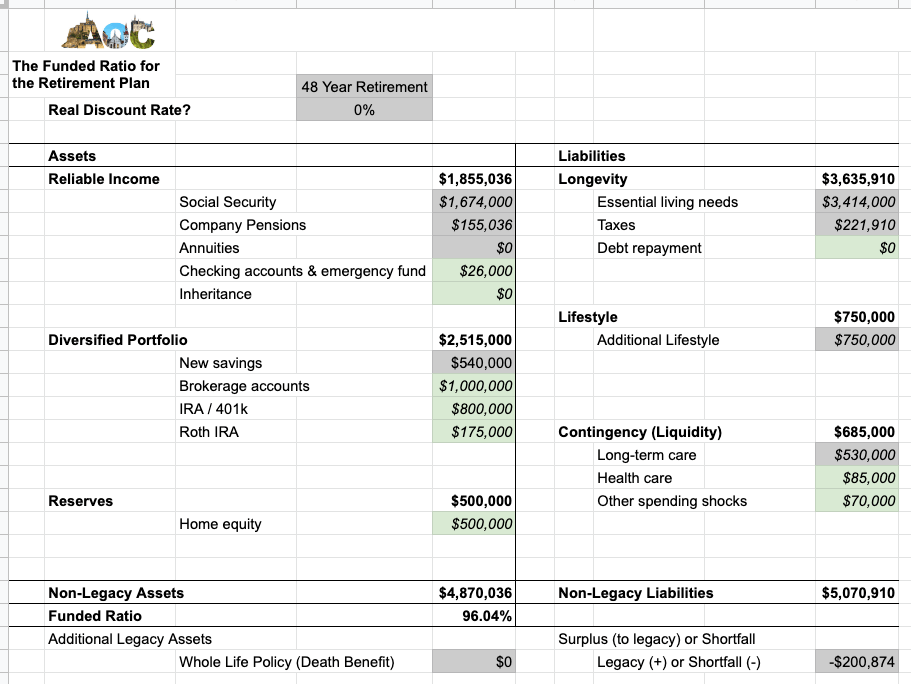
I’ve also added some new things to our AOC Funded Ratio Worksheet that you won’t find in Pfau’s original version. I added a line in for inheritance since we’ve noticed in our coaching sessions that getting at least a small inheritance from parents or grandparents is not that unusual, and those who are expecting to inherit money often want to avoid acknowledging it or if they do talk with us about it there’s often shame or embarrassment. We believe it’s always good to include all of your numbers in your personal finance plans, including inheritance, since those details impact your taxes and other things as well. For example, I inherited $10,000 from my grandparents and used it for a downpayment on my first house when I was in my 20’s. At a 2% inflation rate, its Present Value is about $20,000. I’m not embarrassed about that and I don’t want Ali to feel embarrassed that she won’t inherit money from her family. Money shame is toxic. Acknowledging your real numbers within your personal finance plans is financially healthy, and emotionally healthy as well.
In the AOC version of the Funded Ratio calculator shown below, our values are a bit different than Pfau’s. Our calculator lets you set your retirement date earlier than 65 years old, because that shouldn’t be a hard and fast date for anyone. Our calculator also lets you continue to save additional money up until the date you retire regardless of when that is. As an average profile of folks we’ve coached over the years since we retired, this results in a Funded Ratio of 96.04%.
That’s it for Part 1!
This first review post is focused on Chapters 1 and 3, but I’ve only scratched the surface of what you would find in Pfau’s Retirement Planning Guidebook.
We appreciated learning about the RISA from Pfau and now we’ve added our risk profiles to our big picture retirement plan. The RISA or other types of risk profiles can be an important part of a solid retirement readiness plan for others as well since money and investing can be emotional topics for many (most?) people.
The Funded Ratio calculation is a great tool that can be used no matter where you land in a RISA test or where you are in your retirement planning process. It’s all about evaluating your current assets, estimated future cash flows, and your current and future liabilities as well. And we can never have too much data in our spreadsheets!
Whether you decide to buy this book or not, we hope these personal finance topics are useful for you. Stay tuned for the next post in this series: Part 2, Front Loading Taxes.

Thanks for sharing this great resource and building up spreadsheets to make it easier for the rest of us! Turns out the library has a few copies 🙂
LikeLiked by 2 people
It would have been so hard for me not to have my own copy as I marked it all up with things I want to go back and review again. So many good nuggets. Let me know if you can get through it in the time they let you check it out.
LikeLike
I’m a long way away from retirement, so it’s fine if I need to check it out multiple times to get through it. Mostly hoping the book will illuminate areas that I hadn’t thought about.
LikeLiked by 1 person
Definitely! I’m assuming very few people will get through this book without learning something new or much deeper than they previously knew. Maybe check it out once a year and take notes to add to your own plan!
LikeLike
That’s a great idea! Thanks 🙂
LikeLike
Alison,
Are you preparing to be a professor?! 🙂 What a long article! I’ll have to reserve time to read it (I’m reading a romantic suspense novel now :-P) that I cannot switch gears LOL). OK, I’m not being sarcastic or anything but I like how you both attempt to educate your community and readers on the difficult topics of PF and let’s admit it, Mr. Pfau’s stuff is pretty dry. However, I agree that his latest book is more practical and it’s probably could be imperative to read for the retirees or probably more for people who are nearing retirement. I wasn’t frilled with was his push to annuities (Could it be conflict of interest because he works in that area or at least has indirect relationship to the insurance industry? IDK, I might be biased because the chapter on annuities sounded like a sales pitch and I cannot stand sales people in general).
So, after my disclosure above, I have a few questions (but you retain your right to tell me to read first before asking questions ;-):
– After reading the book or while reading it, did it trigger any doubts in your head that maybe your FIRE budget/portofolio/planning/management isn’t as robust and you should review everything ASAP? If so, could you share areas/examples that you got a bit concerned about?
– I saw a new spreadsheet you designed. Is it separate from the Google sheet files in the earlier articles you had linked to or does it replace the old calculator? I’m asking because I’ve marked a few of your articles to reread again and play with the calcutors at the same time. So, if you could clarify please, I’d appreciate it.
– How many parts do you intend to write and will you keep tweaking the same spreadsheet as you go along or will you create more calculators separately?
– For curiosity: Have you ever used NewRetirement Plus calculator? If so, what are your thoughts about it? I’m considering to sign up but a bit hesitant whether it’s worth it.
Thanks!
LikeLike
Hey S&M,
Thanks for your comment!
Totally not getting ready to be a professor. It’s just the way my brain works. And when one is DIY’n their retirement money, we want to keep learning.
Don’t pick this book up until you are ready. Or just use it like a cook book. Flip around and see what you come across. His writing on annuities seamed a bit more neutral than I have heard from others who I know were salesmen. I wasn’t aware of what could be indirect links to insurance. Interesting. He is running a business about retirement planning so I’m sure he has a bit of bias. I felt he was the most shall we say neutral as 99% of the folks in FIRE are negative about annuities and insurance. However, over time we have met people who would do better with these products as they just don’t want to think about managing their portfolio and don’t want to think about where their income is coming from. But we are still on the less than excited about them either do to their high fee structure, lack of flexibility and inability to pass those moneys on save for an insurance policy.
Now to your questions:
After reading the book we were excited to find that Funded Ratio formula that uses a Present Value approach which was new to us. It uses a 0% discount rate which takes away the tendency to over or under estimate ones plan. And since I am the nervous one in this marriage, we had all ready way over planned our numbers. I think folks can get caught up in pulling the trigger a bit early when maybe they just need a bigger pot of money from which to work from. We always encourage folks to consider saving more than 25X and having a larger budget (even if they don’t use it all in a year). At this point, we would not have done anything differently. We are sticking with our 80/20 allocation now that we have added back in personal real estate. We like our low cost ETFs. We are doing Roth conversions. We will tap my IRA when I turn 59.5 in 1.5 years. We are balancing ordinary and capital gains income to Front Load taxes while managing our ACA premiums. And we have been talking lately about what our “what if levers” that we set up in our PMS document that we could deploy given the state of the world and the market. And we have been invited to 3 weddings next year one of which is in $Australia. I think we will be in a tighter market the next few years and we only wish we had new money to put into the market. But we are not going to change much, we wont sell any more than we need to cover part of our expenses next year and we will not be scared as we have done our home work. And we will keep paying attention, learning and being mindful about our spending.
Each spreadsheet we share is a stand alone sheet to accompany a post.
We are only going to do 3 posts for this book review. I could do more and I might. But for now it’s only 3.
We have used the free version of NewRetirement. It is quite robust. And for some it could be a great tool to further test your plan. Have you joined their Facebook group? I also think they have a podcast. What will always be true about any of these calculators is that they are not crystal balls. They don’t know what policy changes there will be in the future or how the market will respond to events in the world. We have probably tested 20 or 30 calculators like this and other spreadsheets we’ve found over time. And we still had the need to build our own because we always found something the sheet wasn’t covering or taking into consideration that we wanted to look at. So give it a try for a bit. Its not that expensive for a year or two.
Keep the questions coming and let us know what you think about NewRetirement.
~Alison
LikeLike
Ooh! I have a PF crush on Wade. He was my first interview in the way back when…maybe 2013? He was still in Japan, so I remember having to play schedule Gumby with him, and he was very gracious.
BTW, Wade had a position on annuities back in the way back when. His research on SPIAs goes back a long time. There’s also research on the psychological benefit of annuities and pensions. Horses for courses.
LikeLiked by 2 people
Jason, The things one learns when writing a post. Thanks for more background on Pfau. Where is your interview with him? I would love to read it. Cheers!
LikeLike
Here’s the interview: https://www.hullfinancialplanning.com/maybe-you-dont-need-bonds-in-retirement-an-interview-with-dr-wade-pfau-cfa/
Here’s a later follow-up about the psychology of annuities: https://www.hullfinancialplanning.com/will-annuities-make-you-happier/
LikeLiked by 1 person
Thanks for this. Looks like I have some more homework to do over my next morning coffee.
LikeLike
I find great comfort in my pension plan, which I feel is basically an annuity in my case. I could make much more money in a private sector job without a pension, so basically I’m buying my pension.
I love my job and feel like I’m making a difference, so the pension isn’t the main reason for staying, but I thought it might enlighten some to the value of an annuity for some people.
Annuities could be considered self-funded pensions.
I’m aggressively investing and plan to retire early, with my pension a nice safe thought for the future. It brings me comfort.
Thank you so much for this review! I already own the book and am a Wade Pfau fan girl :). I love that he gives people a way to let go of FOMO by telling you what works for your style.
LikeLike
Pensions and annuities can be considered a good source of contractual income. We’re really glad your pension is going to contribute to you feeling safer in your retirement. And we love the message, “find what works for you and stick with it.” ~Cheers!
LikeLike
[…] part book review series about The Retirement Planning Guidebook. In the first post in this series, Part 1, RISA Profiles and the Funded Ratio, I covered Retirement Income Style Awareness (RISA) Profiles from Chapter 1 and the Funded Ratio […]
LikeLike
nice job at spreadsheet! Curious why you included “additional lifestyle” twice in expenses for calculating funded ratio – once in Lifestyle and the other in Longevity where it is summed with essential living expenses.
LikeLiked by 1 person
Nice catch!!!!!! You are correct, I should not have added those together in “Essential living needs” on our sheet. I have fixed it. Glad you liked the sheet otherwise. Cheers!
LikeLike