
NOTE – we have updated the Simpli-FI-ed Calculator so follow this link to the post about version 3!
Here at All Options Considered we like to share tools, information, and resources with our readers to help others with financial literacy. We also want to support people in being as independent and self-sufficient with their personal finances as they are comfortable being. With all of that in mind, we’re releasing the AOC Simpli-FI-ed Calculator to help you estimate your FI number.
First we should mention that if you’ve heard of our super-mega-complex-magic-FIRE-life spreadsheet, that is not what this is. This Simpli-FI-ed spreadsheet is relatively simple compared to our super spreadsheet. And for now our super spreadsheet is still only for personal use during our coaching sessions after a ton of other data collection and soul searching by FI hopefuls. But we figured it was about time to share a piece of that super spreadsheet with everyone, so we’re sharing the new AOC Simpli-FI-ed Calculator.
By the way, since this calculator is a Google Sheet file with complex rules and formulas built in, it can only be used within Google. If you download it and try to use it in Excel or Numbers, it will break. Just click on the link, go to “File” and then “Make a copy” so you can save the calculator to your own Google Drive.
This Simpli-FI-ed Calculator is based on some of the core ideas found in the Trinity Study which pretty much every FIRE blogger references. The FIRE community talks a lot about the 4% rule and the 25 times living expense rule based on that study. In short, the Trinity Study found that if you have saved 25 times your estimated retirement expenses you should be able to live off an initial 4% withdrawal rate every year (increased by inflation there after). That study also predicted that an equity to bond ratio of 50/50 would mean your portfolio should last for about 30 years.
Most people who look into the 4% rule and the 25 times living expense rule have a dream of either being financially independent or retiring early, or both. With this in mind, it’s important to look past baselines and averages. The Trinity study was geared towards an average retirement and derived from data collected back in 1998 when the study was published. Most of us aren’t average and it’s November of 2020 as we write this post. The Trinity Study’s standard portfolio life ranging from 15 to 30 years was based on the life expectancy of the average retiree way back when, so that may not be enough years or enough money in many cases today depending on your circumstances and your goals. Because of that, we’ve built the Simpli-FI-ed Calculator to be adjustable so you can set the parameters to be more or less conservative. When you calculate your own FI number be sure to consider your comfort level, your needs, your risk tolerance, as well as your specific and very personal FI goals.
Just like so many others, we loved the simplicity of the guidance in the original Trinity Study and used it as a baseline to build our own FIRE plan. We adjusted the baseline to fit our own portfolio and FI comfort level, and ended up with a 3% withdrawal rate to start our FIRE years with 33 times living expenses already invested.
Here’s How it Works
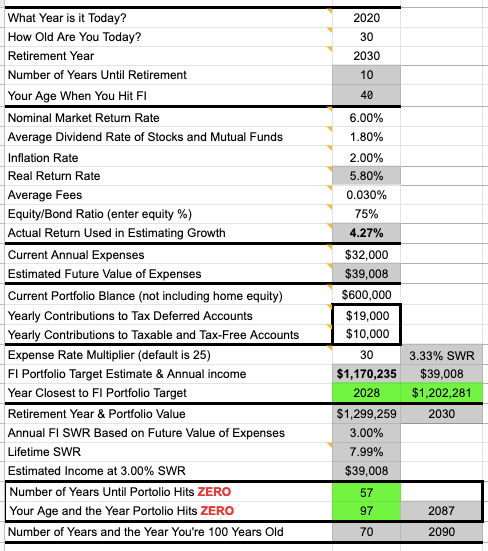
The Simpli-FI-ed Calculator uses some basic information including your age, the year you want to be FI or FIRE, market growth rate, inflation, estimated expenses, portfolio value, additional contributions, life expectancy, and the expense rate multiplier (with a default baseline number of 25) for your annual expense number.
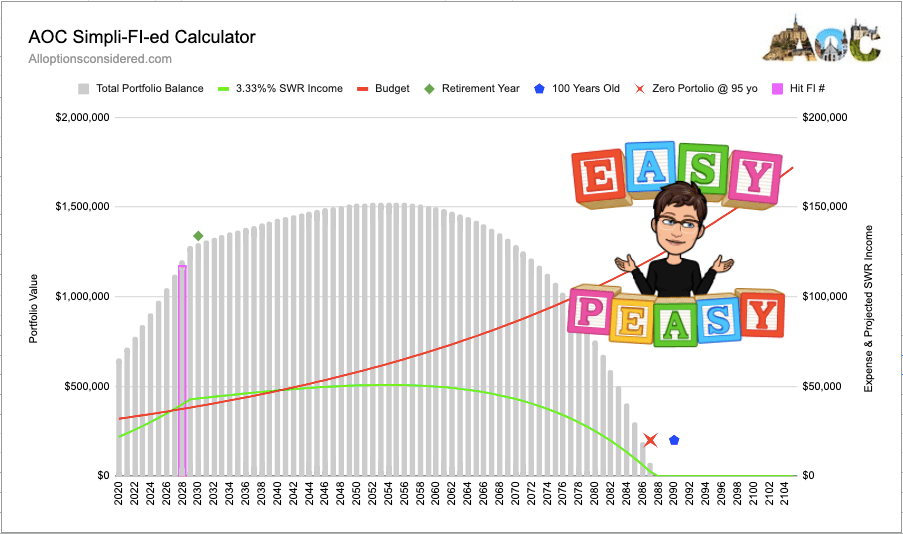
After you enter your numbers and your goals into the Simpli-FI-ed Calculator, it will do the math and generate a cool graph for you to work with. With this graph you can see if you’re on track to hit your FI number and how long your portfolio might last. It’s then super easy to change some of the inputs to see how you need to adjust in real life to reach your goals.
The graph will show your portfolio as it grows as well as what it looks like as you continually draw down the balance. It also illustrates the way your portfolio gets drawn down and then generates less and less income as your original withdrawal amount increases with inflation. Not to worry, as long as you start with a big enough balance and that stash outlasts you, it’s all good. Whether you run the calculator once with a fixed set of numbers, or run it multiple times with multiple scenarios to work with like us, we hope this calculator is helpful for you.
A Few Things to Remember
Age: Retiring at 65 is not a rule we all need to live by. If that’s your goal there’s nothing wrong with that, and good for you! If you want to retire early, then do some dreaming about your own life and enter your retirement year target.
Market Returns: Do some research when picking the growth rate that feels right for you. No one can predict how their portfolio will perform with complete accuracy since we can’t predict or control economic factors, political forces, or market sentiment. With that in mind it’s a good idea to be a little conservative when picking the growth rate you base your FI calculations on. From our perspective being a little conservative gives us the best chance of being pleasantly surprised by our portfolio growth in the future. One option is to start with 6% and adjust down or up as you feel comfortable.
Expenses: If you don’t know what your expenses are right now, it’s time to start tracking to find your true number. And remember that if you are a W-2 employee today, your expenses at this moment most likely don’t include the full cost of healthcare and taxes. Do some research to see what healthcare expenses are for people who have to pay them without an employer. Also, do some research to see how much people pay in taxes without an employer. Then add back some or all of those costs when estimating your expenses so you’re using a more realistic number for later years when you aren’t employed.
Portfolio, fees, and equity/bond ratio: Add up all of your taxable and tax deferred accounts. Include your HSA if you have one. Track down any orphan 401k or 403b accounts that might still be held by an old employer. It might also be time to open up a Personal Capital account (or something similar if your money lives outside of the USA). We know from experience that having a free Personal Capital account means you’ll probably get a phone call encouraging you to buy additional services, but we simply said no thank you and asked that they not call us again. Done. Their free accounts can help you track all of your accounts and identify how much of your portfolio is in equities. Most importantly it can also show you how much you’re paying in investment fees.
Contributions: We recommend using all possible avenues for saving and investing to reach your FI goal. So we’ve broken out annual target contribution rates for tax deferred accounts separate from annual target contribution rates for taxable and tax free accounts. You can test your FI calculation with a few different sets of numbers, including the allowed limits for tax deferred and tax free accounts. You can find the current limits on the IRS website.
Expense rate multiplier: The Trinity study starts out at 25 times your estimated retirement expenses, which is a good baseline. Remember that your retirement expenses are probably different from your pre-retirement expenses, and that number will likely increase over time due to inflation at a minimum. It’s a good idea to add some flexibility into your plan by increasing your estimated retirement rate multiplier in order to also extend the life of your portfolio past the baseline of 30 years.
The rest of the bells and whistles in the Simpli-FI-ed Calculator show what your starting Safe Withdrawal Rate is estimated to be given all of your inputs, how long your portfolio should last, and when you will be 100 years old. We all have to have goals right?
What If I’m Short?
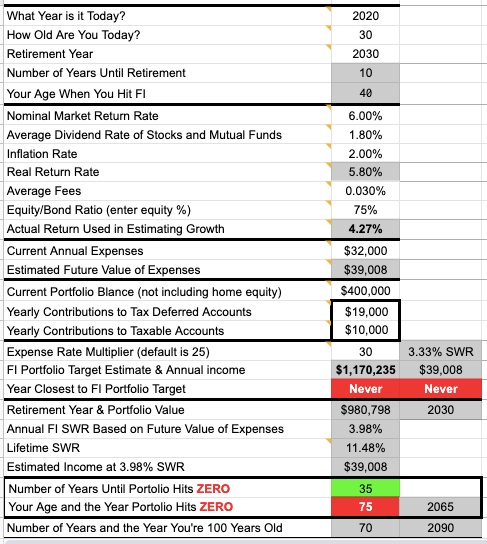
If you’re short on money and the numbers you inserted in the calculator don’t show you reaching your FI goal, the calculator will tell you. If the calculator thinks you might need to save more money to hit your FI number some key cells will be highlighted in RED, just so you don’t miss anything. The calculator will also make it clear if there’s no year when you would hit your FI number with the existing figures you’ve included.
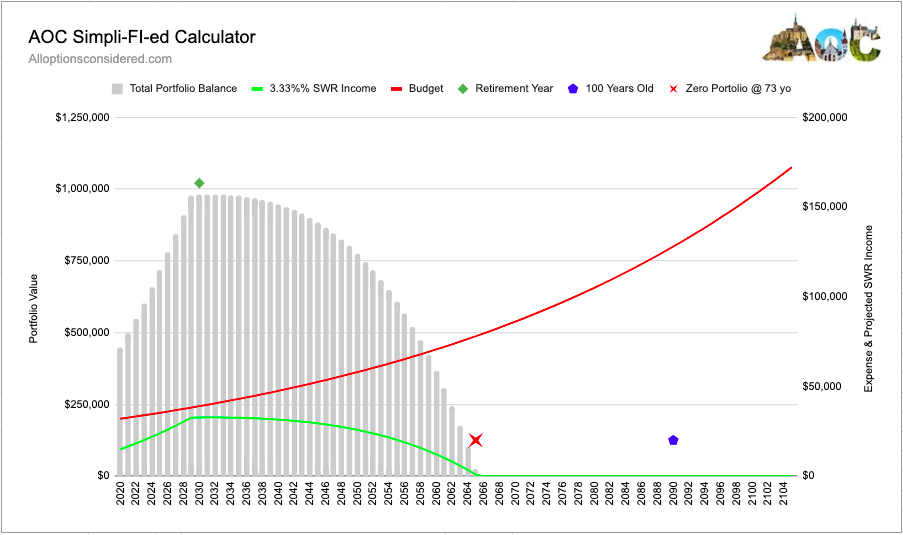
If the numbers you’ve inserted in the calculator don’t hit your FI goal, the graph will also tell you. First of all, you won’t see that cool magenta bar on the graph since there’s no year when you would hit your FI number in the existing calculation. In this example below the green safe withdrawal income line never touches the red budget line, and the green line drops further and further as the red line keeps going up. This is a clear warning that the portfolio needs to be larger and the retirement timeline needs to change in order to reach the FI target.
Making Adjustments
If your first few calculations don’t work out, don’t freak out! Unless you’ve been an aggressive saver since high school, it’s normal to make adjustments a few times before your path to FI is 100% clear. It’s best to change one cell at a time, and take notes as you go so you can return to a baseline setting for comparison as you bring the data inline with your goals. Here are a few ideas for making adjustments…
- If you’re set on your timeline, add more annual savings.
- If you’re set on your savings rate, add a few more years until retirement.
- If you have a long time to go to get to FI and you have a conservative equity percentage, shift the allocation higher.
- If you’re close to retirement and you know you have a pension or feel confident about social security coming, it’s time to use other income types to find your Gap Number. If you won’t have to cover all of your expenses from your portfolio, finding your Gap Number might be the key to reaching your FI goal.
Gap Number
Below the main worksheet area are two more mini calculators. The first one helps you calculate how much of your expenses really have to be covered by your portfolio. Simply add all of your expenses, including any taxes and healthcare costs as well as your daily living costs. Then subtract any expected pensions, social security, or rental income. Boom, that’s your Gap Number. Now, enter the Gap Number in the expense line and see how your numbers change. You might find you are 100% on track as we found in our case study for the Wannabe Retiree.
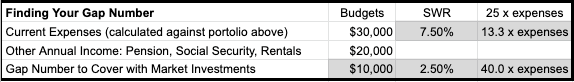
Realizing you might have a small pension, social security, or rental income to help reach your FI goal is like having a little pot of gold you forgot about. If you can reduce your expense number to cover only the Gap Number that your portfolio won’t cover, you might be pleasantly surprised.

Saving Enough?
The second mini calculator takes a look at how much you’re be saving in your 401k to see if you’re maxing out this tax deferred account. It’s always better to target a dollar amount rather than a percentage when saving. That way you’ll always be looking to a specific amount instead of an “idea” of what someone else thinks you should be saving.

That’s it! You’re On Your Way!
Running your FI numbers can be scary for some people. It took me years to find the courage to run our numbers this way. But it doesn’t have to be scary. Information is power and it gives you the data you need to make changes. Information also tells you when it’s time to celebrate. So have fun with this calculator and enjoy planning for your future.
Have any questions? Check out this page for more links and tools as you work towards your FI goals. And as always, feel free to email us if you have any questions or just want to chat!
We are not certified financial professionals. For more information about us please read our Disclaimer.

Squeee!!!! I may quit my job to go play with my numbers! 😉
LikeLiked by 2 people
Sounds like you are having fun! Hope you enjoy the calculator, and that it helps you find your path to FI!
LikeLike
I love a good spreadsheet. And this is a great spreadsheet!
Adding to my shrine 😉
LikeLiked by 1 person
Thanks Jay. That’s a real compliment coming from you. It’s hard to decide how many data points to add or leave out. I think this has enough for anyone to get a really good start. Have fun with it and we’re always open to feedback….
LikeLiked by 1 person
Excellent work Alix2!! Very detailed post.
I’ll be honest though that’s the first time I’ve ever looked at any SWR spreadsheet or FIRE calculator, thinking about a specific lofty future number was always way too disheartening when I was working, unhappy and desperate to quit..
The strategy I found exciting that got me through the slog was to supercharge the investing and bring the quit date closer using Dividend Growth stocks with constantly reinvested dividends, the snowball rolling down a slope analogy fits perfectly. Still doing the same to this day but without the reinvesting, hopefully if we can keep on top of selling any dividend cut stocks and stick to long term quality growth names then the income curve should always point upwards in line with or above any inflation/SWR.
Hope you’re both enjoying Cowes!
Looking forward to the end of lockdown/vaccine.
Dave
LikeLike
Hey Dave,
Thanks for that. We had fun putting this one together for sure. And I hear ya about getting disheartened when starting out. Thats why we mostly kept our heads down, worked hard and put away as much as we could spare. And it wasn’t until the summer of 2017 I had the nerve to add it all up. Thank goodness for the the luck of the tail wind from that massive bull run.
Question: how did you know when it was time to pull the plug and quit work?
Yes, we are looking forward to the end of lockdown and a few pints with two good friends outside.
~Alison
LikeLike
I actually wound up enjoying the lead-up to the quitting part, I would basically choose a bill and allocate a certain set of dividends to paying it. i.e. stocks from utility companies like Duke, Southern Company and PPL would pay our utility bills, AT&T, Verizon and Singtel would pay the cellphone bills, Chevron, Shell and BP would cover vehicle running costs, and so on.
This strategy actually got me through some really horrendous times, I could deal with all the work negativity a lot more easily as long as I knew each wage was going towards each of the regular bills getting paid by particular growing dividends. After each I would drum roll and announce along the lines of “I’m never going to pay an electricity/trash/insurance bill ever again for the rest of my life” the progress just made me smile inside when I was otherwise experiencing so much unhappiness and pressure in the work meetings daily.
The light at the end of the tunnel was when every worst case bill was more than adequately covered by dividends I could quit and retire. Which I did 🙂
So I never really got into the whole FI number in terms of specific monetary amounts, just making sure all the bills were covered with growing dividends was enough and to keep them growing from thereafter. I now have over 160 stocks and never sell unless they cut or suspend a dividend longer term.
The strategy is to now keep all dividends and overall portfolio growing so that as we get into our later years we have a lot more income than when we retired.
Apologies, that answer was a little long.
LikeLiked by 1 person
Love this long answer! Thank you for sharing. We each have our own unique way of tackling this puzzle. And building a dividend producing stock portfolio is a solid approach. I also know from some of our other conversations you have 2 rental properties. Did you do most of your investing in a brokerage account or in tax deferred accounts???
LikeLike
I guess all the above really. The overall portfolio is split into 3 equal size segments:- 1/3 – rental property no 1 was fixer upper accumulated proceeds from multiple US properties, rental no.2 was proceeds from UK properties. 2/3 – Company Roth 401k mainly funded by tax-free contributions and full employer match then flipped to Roth IRA post-employment. 3/3 Brokerage – funded by any company bonuses, tax refunds, dividend reinvestment and organic dividend growth.
LikeLiked by 1 person
This is so fantastic. I have a question!
Right now my mortgage + overpayment works out to at least $24k/year that I won’t need once it’s paid off. I expect to be paid off in 7 years, and I intend to stay where I am.
Granted I’ll have new shiny expenses like health care, and will still want to set aside money for house maintenance, but would you suggest I just subtract that mortgage-specific 24k from my projected annual outgo? Or maybe half that?
LikeLiked by 1 person
Good question. I can see reducing your expenses a bit but with taking on taxes and health care, they might swallow back up that out lay down the road. You might try “reducing” your expenses in 1/4’s that represented your mortgage and see how you “feel” about the results. What does Simple-FI-ed look like when you plug all this in to start with?
LikeLike
I fiddled with the numbers a few ways:
I pretended that the ~$10k overpayment/year is going into savings, and then reduced my expenses by that same 10k (FI in 5 years!). Then I pretended my annual expenses are 0 mortgage but + $1000/mo for health, taxes, home maintenance (FI in 7 years!). Then I figured out the highest annual spend I can have and still hit FI in 9 years. Fun calculator!
In all cases I’ve kept my Social Security at the lowest/62-year-old-me amount. I fully intend to wait as long as I can, at least to 66, but want to be conservative there. I do see a bit of a gap in the calculator though, since I’ll have to rely fully on my assets for the first number of years in retirement. But then it IS the so-called simplified calculator!
Funny side note: I’ve become so enmeshed in politics that at first glance I thought your calculator had something to do with the esteemed US Representative from New York! 🙂
LikeLiked by 1 person
Oh, yes, we do get that association with the Rep from NY frequently. We are happy to get that regardless.
I like the approach you’re taking working with the calculator. And I like that you are assuming taking SS at 62 for now. And yes, this calculator is not our super fancy one that does take all of what you’ve described into account. Hence, “simpli-FI-ed”….. Have a look at cfiresim.com or firecalc.com or even a free account at Personal Capital if you want to dive in even more. Or even take a crack at building your own customized spread sheet. I’ve had a ton of fun, you might too…..Cheers.
LikeLike
Since FI is a long way away, I’ve been running many different scenarios. While reading this article, I thought it might be interesting to calculate how much would need to be saved in after tax dollars to cover all years of annual expenses necessary to completely Rothify the 401k amount at the maximum possible speed in lowest tax bracket. My current work does not offer a Roth 401k. This would also need to account for changes in tax and healthcare laws, so it would need to evolve over time. If I create any semblance of something useful, I’ll share it. It could be pretty motivating to stick it out if only a year or two could allow for certainty of Roth conversions without negating healthcare subsidies.
LikeLike
There are a ton of moving parts that we can not predict for sure. The other think to look at is starting to take money out of the IRA or 401k at 59 1/2 as you will be doing so to do Roth conversions and having to pay taxes anyway. Our big concern with having BIG RMDs in the future that would push our income over an inflation projected 12% tax bracket. And thats the time we are trying to adjust for now. We are seeing that if we have to be on the ACA there will be no way to do big enough Roth conversions to empty the rollover IRAs. But if we switch over to living on the IRA at 60 we can moderate the growth of those RMDs. And if we put “enough” in the ROTH over time to be there to cover big medical expenses tax free, we’re liking that idea. And yes, if you have any discovery when running your tests, please do share. Cheers!
LikeLike
Thank you for the thorough reply! Just watched the Motley Fool interview. It seems like you two genuinely enjoy talking about this stuff! When I have some time to implement as much as I can decipher, I’ll send over what I create along with the assumptions and formulas used in email format if that is acceptable.
LikeLike
That would be interesting to review. Send away after you’ve done your number crunching.
LikeLike
[…] advisor in any capacity while managing our own portfolio of investments and creating our FIRE plan. We still test our portfolio with our calculators and other people’s calculators. But we don’t worry about longterm portfolio recovery […]
LikeLike