
After we reached FIRE (financial independence / retire early) we started sharing tools, information, and resources with our All Options Considered (AOC) readers to help others with financial literacy. We also want to support people in being as independent and self-sufficient with their personal finances as they are comfortable being. With all of that in mind, we’re releasing an updated AOC Simpli-FI-ed Calculator v3 to help people do the math as they work towards FI.
Why a new version? The original calculator was intended to be as simple as possible. Hence the name! For example, when we calculated our own FIRE numbers we didn’t include Social Security in the mix. We were being FIRE conservative and we wanted to know our numbers would work even if Social Security didn’t exist. But lots of people asked for the addition of Social Security so that was the first change on our list. We also heard from a bunch of people who have pensions either from government employers or corporate employers (or both) asking if we could add that type of income to the calculator so that was the next change on our list. The other requests for changes came from people who told us they want to be able to factor in major one time expenses (like buying a car or buying a house) and major one time windfalls (like selling a house or inheriting money). We listened, and the updated calculator now does all of this!
And by the way, if you’ve heard about our super-mega-complex-magic-FIRE-life spreadsheet, that is still not what this is. V3 of our Simpli-FI-ed calculator is relatively simple compared to our super spreadsheet. For now our super spreadsheet is still only for personal use during our coaching sessions after a ton of other data collection and soul searching by FI hopefuls. But we’re happy to share a piece of that super spreadsheet with everyone in our new and improved AOC Simpli-FI-ed Calculator.
Our calculator is a Google Sheet file with complex rules and formulas, and this calculator can only be used within Google. It will not work if you try to download it and open it with Excel or Numbers. Just click on the link above, go to “File” and then “Make a copy” so you can save the AOC calculator to your Google Drive and make it your own.
In the Beginning, the Trinity Study
This Simpli-FI-ed Calculator is based on some of the core ideas found in the Trinity Study, which pretty much every FIRE blogger references when they talk about the 4% rule and the 25x living expense rule. The Trinity Study found that if you save 25x your estimated retirement expenses you should be able to live off a 4% withdrawal rate initially, increased by inflation after that. The Trinity Study also predicted that a minimum equity to bond ratio of 50/50 would mean your portfolio should last for about 30 years.
Most people who look into the 4% rule and the 25x living expense rule have a dream of either being financially independent or retiring early, or both. Just like us! With this in mind, we think it’s important to look past generic advice, baselines, and averages. Even if the baseline concepts are really cool like these ideas stemming from the Trinity study. It’s important to keep in mind that the Trinity Study was geared towards an average retirement, it wasn’t written for and by the FIRE movement, and it was derived from data collected back as of 1998 when the study was published. It’s mid March of 2021 now as I write this post and most of us certainly aren’t average, which means we all need to go deeper and get more personal with our personal finances instead of just assuming the Trinity Study is infallible. The Trinity Study’s standard portfolio life ranging from 15 to 30 years was based on the life expectancy of the average American retiree from way back when. It’s possible that the study’s assumptions may not have calculated enough years or enough money to be a perfect match for many FIRE cases today, depending on your circumstances and your goals.
We loved the simplicity of the guidance in the original Trinity Study and we did use it as a baseline to build our own FIRE plan. Ali and I plan to keep enjoying our retirement for much more than the next 30 years. That’s why we built the Simpli-FI-ed Calculator to be adjustable so you can set the parameters to be more or less financially conservative to fit your personal finances. In our case we adjusted the baseline to fit our own portfolio, our goals and needs, and our FI comfort level, and we ended up with a 3% withdrawal rate to start our FIRE years with 33x our pre-retirement living expenses already invested. When you calculate your own FI number be sure to consider your comfort level, your needs, your risk tolerance, as well as your specific and very personal FI goals.
The Cool Graphs
The Simpli-FI-ed Calculator v3 uses some basic information including your age, the year you want to be FI or FIRE, market growth rate, inflation, estimated expenses, portfolio value, additional contributions, and an expense rate multiplier (with a default baseline number of 25) all to calculate a target portfolio value. You can run the calculator using some baseline figures or you can personalize your numbers and make sure they are a good fit for you.
After you enter your numbers and your goals in the Simpli-FI-ed Calculator, it will do the math and generate a cool graph. With this colorful graph you can see if you’re on track to hit your FI number and how long your portfolio might last. It’s then super easy to change some of the inputs to see how you need to adjust in real life to reach your goals.
The graph will show your portfolio as it grows as well as what it looks like as you continually draw down the balance over time. Not to worry, as long as you start with a big enough balance and that stash outlasts you, it’s all good. Whether you run the calculator once with a fixed set of numbers, or run it multiple times using multiple scenarios like us, we hope this calculator is helpful for you.
Example 1 – Initial Calculation
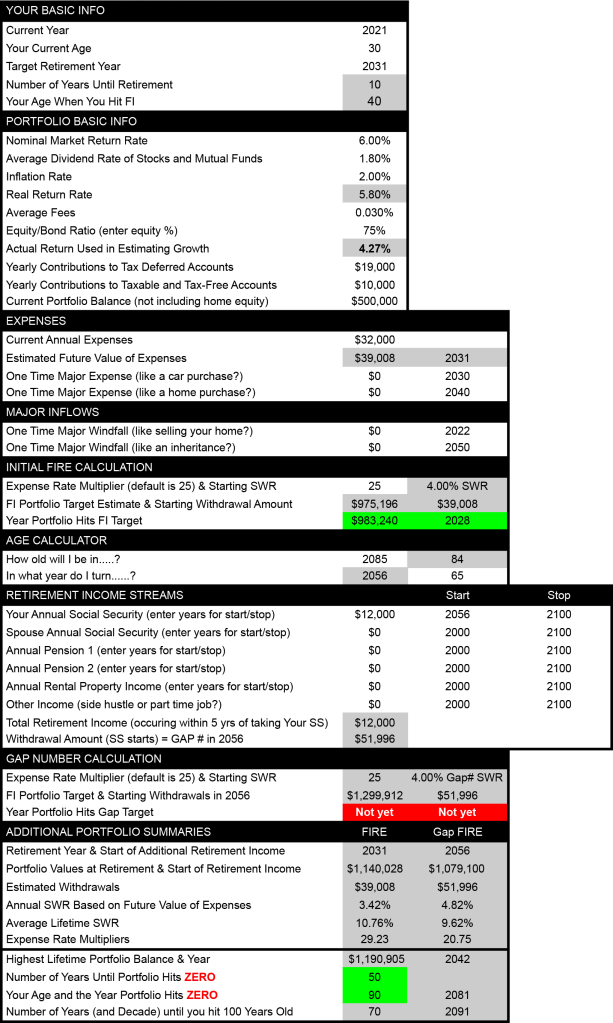
In this example this person is currently 30 years old and wants to retire at age 40. All of their initial FI numbers have been entered in the data collection part of the calculator. Their portfolio balance is $500k, they are contributing $19k annually to their tax deferred account and $10k annually to their taxable brokerage account. They’ve also taken the time to add their estimated Social Security income, and that one additional stream of income reduces the drag on their portfolio in the later years of their retirement. But there are still red flags making it clear they aren’t hitting all of their targets. Their biggest concern is that with this current set of inputs the calculator shows their portfolio will not last long enough to cover all of their estimated retirement years.
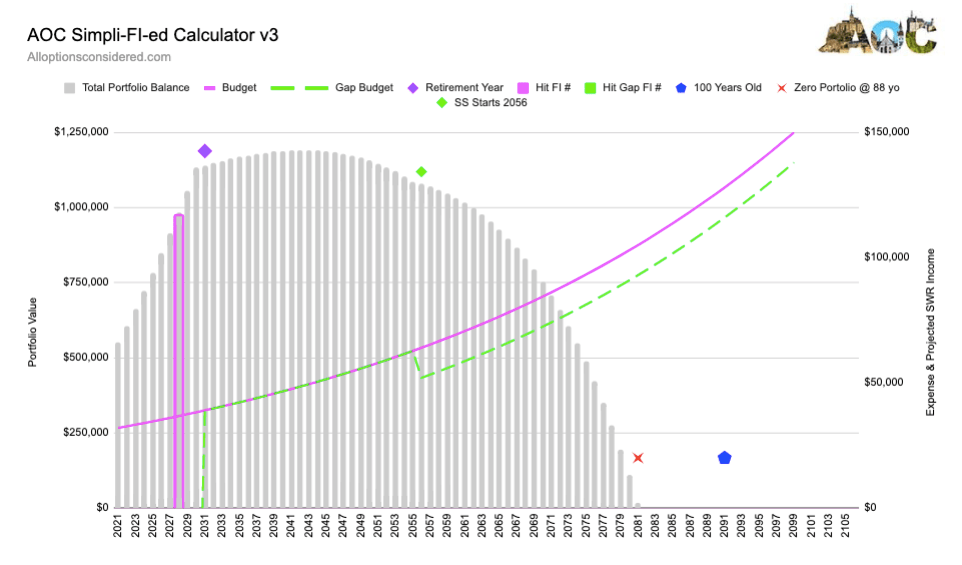
The graph below shows that they will hit their FIRE number. The bar outlined in magenta represents the year their portfolio hits the 25x expense multiplier value they entered in the calculator. You can also see their starting budget line in magenta, arcing up towards the top right corner of the graph. Since they also entered their estimated Social Security income, their adjusted budget is represented by the dashed green line.
The additional retirement income slows the pace of drawing down their portfolio balance a bit since the amount of their withdrawals is reduced by the amount of their Social Security payments. The graph below also shows when this person’s portfolio will run out of funds, and in this example their portfolio lasts 50 years and expires by the time this person is 90 years old. They are concerned this portfolio outcome may not be long enough.
Example 2 – Adjustments
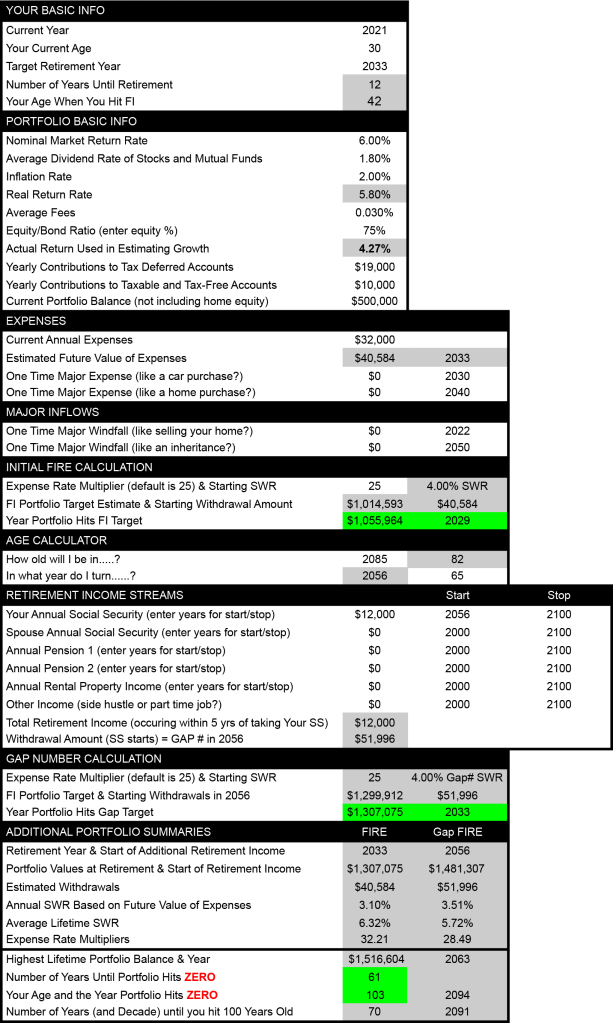
Since their first run in Example 1 showed a depleted portfolio by the time this person would be 90 years old and they feel that is just too early to run out of money, they made some adjustments to the numbers in the calculator. With just one primary change to their calculation, everything changes! In this example this person is currently 30 years old and wants to retire at age 42. By pushing their retirement date out just two more years they can add two more years of income and investment account contributions, also allowing their portfolio to grow for two more years without withdrawals. And now the calculator shows all green, which is good!
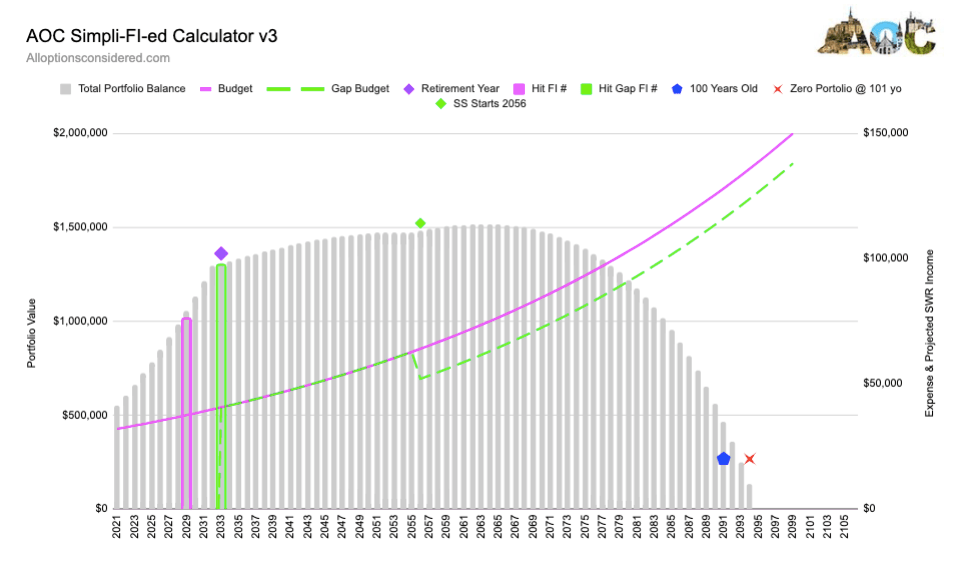
Adding two years of extra income gives their portfolio a boost and the addition of early Social Security lowers the demand on their portfolio. In the graph below we now see a green outline highlighting the year this person hits their Gap FI number. And the red X for the year their portfolio balance hits zero has been pushed out to when this person is 103 years old, which is a much more comfortable outcome.
A Few Things to Remember
Retirement Year: Retiring at 65 is not a rule we all need to live by. If that’s your goal there’s nothing wrong with that, and good for you! If you want to retire early, then do some dreaming about your own life and enter your retirement year target.
Market Returns, Inflation, Allocation, and Fees: Do some research and pick the growth rate, inflation, allocation, and fees that feel right for you. No one can predict how their portfolio will perform with complete accuracy since we can’t predict or control economic factors, political forces, or market sentiment. With that in mind it’s a good idea to be a little conservative when picking the growth rate you base your FI calculations on. From our perspective being a little conservative gives us the best chance of being pleasantly surprised by our portfolio growth in the future. One option is to start with 6% as the nominal market return rate and then adjust down or up, but do your own research and pick numbers you are comfortable with.
Contributions/Savings: We recommend using all possible avenues for saving and investing to reach your FI goal. We’ve broken out annual target contribution rates for tax deferred accounts separate from annual target contribution rates for taxable and tax free accounts. You can test your FI calculation with a few different sets of numbers, including the allowed limits for tax deferred and tax free accounts. You can find the current limits on the IRS website.
Portfolio: Add up all of your taxable and tax deferred accounts. Include your HSA if you have one. Track down any orphan 401k or 403b accounts that might still be held by an old employer. It might also be time to open up a Personal Capital account (or something similar if your money lives outside of the USA) for the purpose of getting a really good look at your total portfolio. We know from experience that having a free Personal Capital account means you’ll probably get a phone call encouraging you to buy additional services, but we simply said no thank you and asked that they not call us again. Done. Their free accounts can help you track all of your accounts and identify how much of your portfolio is in equities, bonds or “other.” Most importantly it can also show you how much you’re paying in investment fees.
Regular Expenses: If you don’t know what your expenses are right now, it’s time to start tracking what you spend to find your true number. And remember that if you’re a W-2 employee today, your expenses at this moment most likely don’t include the full cost of health care and taxes. Do some research to see what your health care expenses might be without an employer. Also, do some research to see how much people pay in taxes without an employer. Then add some or all of those costs when estimating your post-retirement expenses so you’re using a more realistic number for later years when you aren’t employed.
Expense Rate Multiplier: The Trinity study starts out at 25x your estimated retirement expenses, which is a good baseline. Remember that your retirement expenses are probably different from your pre-retirement expenses, and that number will likely increase over time due to inflation at a minimum. It’s a good idea to add some flexibility into your plan by increasing your estimated retirement rate multiplier in order to also extend the life of your portfolio past the Trinity Study baseline of 30 years.
Safe Withdrawal Rate: Our calculator shows what your starting SWR is estimated to be given all of your inputs. Because we’re talking about SWR our calculator will also show how long your portfolio should last, and what your portfolio looks like when you will be 100 years old. And yes we do factor in some kind of life expectancy. We all have to have goals right?
More Things to Remember – The Updates!
One-Time Expense or Windfall (NEW): In the latest addition of the Simpli-FI-ed Calculator we added a place to calculate a couple of one-time large expenses such as a car purchase or home purchase, and a couple of one-time windfalls such as receiving an inherited IRA or selling a house. There are lots of people in the FIRE community who tell us about their major one-time expenses and windfalls and how they impact their portfolios and their withdrawal strategies so we figured it makes sense to allow room for those scenarios. It’s interesting to see what happens when a portfolio has a big one-time hit or windfall, so if you’re expecting any of those types of scenarios now you can plug them into the calculator and see how they might impact your FIRE plans.
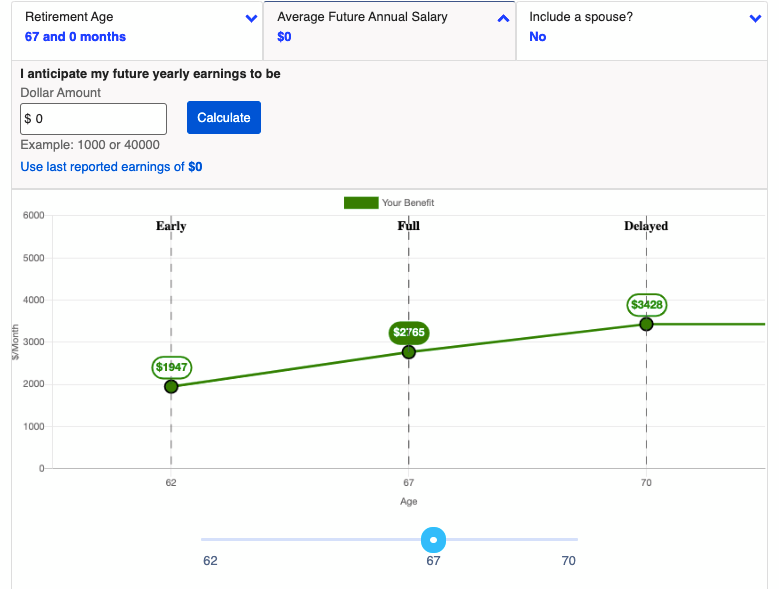
Social Security (NEW): Some of us like to include Social Security in our FIRE calculations and some of us don’t. But with this version of the Simpli-FI-ed Calculator you now have the option to include Social Security and it’s easy to run your calculations both with it and without. You can find your current Social Security estimates online and use real numbers in your calculation. Just remember that if you retire early the estimates you see in the system may need to be adjusted to reflect what you will actually receive if you retire early. So when you set up an SSA account and find your current Social Security estimates, scroll down to their fancy new Social Security calculator and use an average future income of Zero to see how your Social Security numbers change.
Pensions (NEW): Some lucky FIRE unicorns have access to pensions. Depending on your type of pension and how and when you want to take it, there now is a place to add this future income in our calcuator. Please do your research with your plan administrator and gather all of the info about your pension so you can play with all of your options.
Other income (NEW): You might also be someone who has a rental property, or maybe you plan to have one or some rentals for other income in the future. Or maybe you’re someone who wants to have a side hustle for other income. You will be happily surprised at what a difference even a part time job can do in reaching your perfect post FIRE portfolio.
Retirement Income / Gap Number (NEW): Your gap number consists of your expenses less any retirement income streams. For example, if you expect to have $70,000 in expenses when you start taking $20,000 in Social Security at 65 years old, your portfolio won’t really have to cover all of your expenses it will only have to cover the $50,000 “gap” between your expenses and your Social Security income. It’s always a good idea to see how early or standard or late Social Security income streams during retirement can change your FIRE calculations. So add up whatever Social Security, pensions, side hustles, or rental property income you might have during retirement to find your gap number. And then run your FI calculation with your gap number included, and you might find you’re closer to your goal than you originally thought. We found this to be true in our case study for the Wannabe Retiree. Thankfully, V3 of this calculator will do this automatically after you enter in all your information.
Another Thing – Are You Saving Enough?
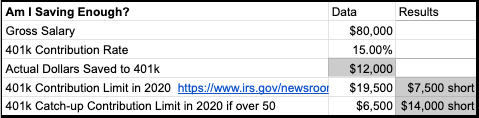
The mini calculator pictured below looks at how much you’ll be saving in your 401k or other employer sponsored tax deferred account to see if you’re maxing it out. The default in this table is 15%, but this is a field that should be personalized like so many other parts of this calculator. The first thing to remember when trying to maximize your savings is that it’s always better to target a dollar amount rather than a percentage. So do the math to find the maximum dollar amount you can invest in your tax deferred account and then see what percentage that is of your gross salary.
EXAMPLE 3 – What If I’m Short?
If you’re short on money and the numbers you inserted in the calculator don’t show you reaching your FI goal, the calculator will tell you. If the calculator thinks you might need to save more money to hit your FI number some key cells will be highlighted in RED, just so you don’t miss anything. The calculator will also make it clear if there’s no year when you would hit your FI number with the existing figures you’ve included.
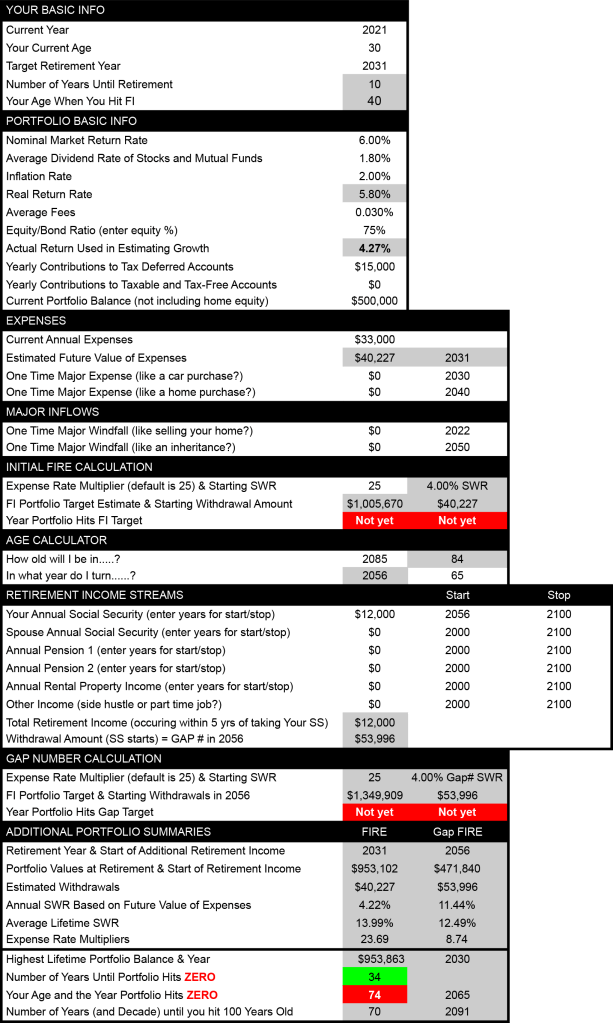
This person’s FIRE numbers and their gap number after Social Security are all summarized in the table below. In this example this person is currently 30 years old and they want to retire at age 40. All of their initial FI numbers have been entered in the data collection part of the calculator. Their portfolio balance is $500k, but they’re only contributing $15k annually to their tax deferred account and they aren’t making any contributions to a taxable brokerage account or a tax-free account. They did include their estimated early Social Security income which is $12k per year. Unfortunately there are a bunch of red flags making it clear they aren’t hitting their FI targets. This person’s portfolio was projected to last 34 years, which means they would only be 74 years old when their portfolio runs out of funds. Time to make some adjustments!
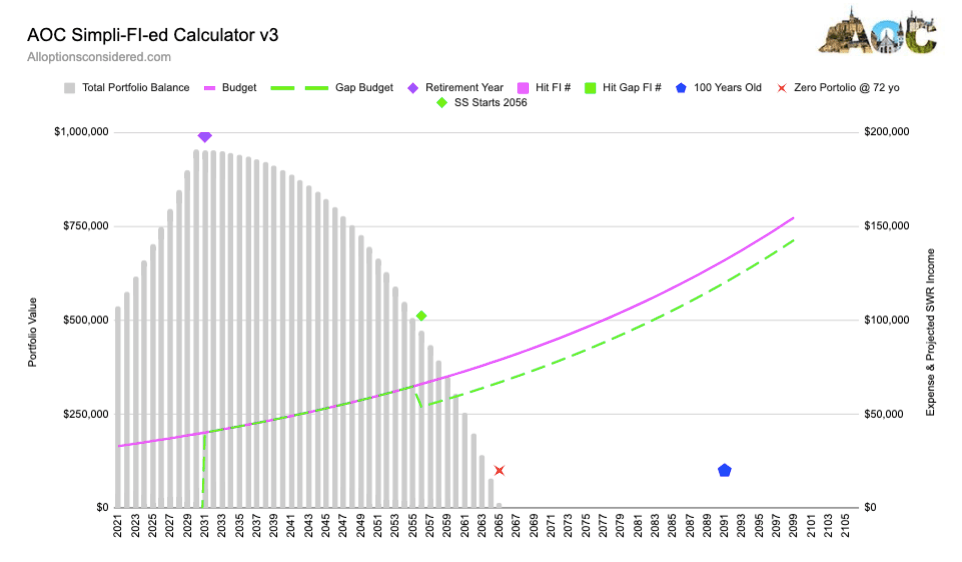
The graph below doesn’t include that cool magenta bar on any year since there’s no year when this person would hit their FI number with the existing calculation. There’s also no green bar for their gap number on any year since there’s no year when their portfolio is large enough to meet the gap number targets they entered in the existing calculation. And it’s easy to see that the red X on the graph for when the portfolio balance drops to zero is almost 30 years before the blue pentagon when this person would turn 100 years old.
Making Adjustments
If your first few calculations don’t work the way you had hoped, don’t freak out! Unless you’ve been an aggressive saver since high school, it’s normal to make adjustments a few times before your path to FI is 100% clear. It’s best to change one cell in the calculator at a time, and take notes as you go so you can create your own baseline setting for comparison as you bring the data inline with your goals. Here are a few ideas you might try for making adjustments…
- If you’re set on your timeline, try adding more to the annual savings amount.
- If you’re set on your savings rate, try adding a few more years before retirement.
- If you have a long time to go to get to FI and you’re currently using a conservative equity percentage, try increasing your equity allocation for more growth.
- If you’re close to retirement and you have a pension or feel confident about relying on Social Security, try adding other income types after retirement to lower the gap number you need to cover with other funds.

That’s it! You’re On Your Way!
Running your FI numbers can be scary for some people. It was scary for me! It took me years to find the courage to run our numbers this way. But it doesn’t have to be scary. Information is power and running your numbers will give you the data you need to make plans and changes. Having more information will also tell you when it’s time to celebrate. So have fun with this calculator and enjoy planning for your future!
Have any questions? Check out this page for more links and tools as you work towards your FI goals. We would definitely recommend that you try other calculators as well including the fabulous cFIREsim calculator, a historical backtesting tool that does all kinds of cool things. And as always, feel free to email us if you have any questions or just want to chat!
We are not certified financial professionals. For more information please read our Disclaimer.

[…] NOTE – we have updated the Simpli-FI-ed Calculator so follow this link to the post about versi… […]
LikeLike
Thank you for sharing this spreadsheet, it is a great tool!
I may be interpreting this tool incorrectly but when reviewing your calculations I noticed that you are increasing the portfolio by the net income (income less expenses less withdrawal) times the real return rate times the equity/bond ratio. I believe this may be incorrect as you are already accounting for inflation by increasing the withdrawal rate by inflation.
My logic is that if you are increasing the withdrawal rate by inflation (which I agree with) you must also increase your portfolio each year by the nominal rate (including inflation), otherwise you are negatively accounting for inflation on your portfolio twice (in the withdrawal rate and then again in the rate of return). I believe it would be more accurate to either freeze you withdrawal rate (don’t increase with inflation each year) and calculate your portfolio growth using a real rate of return or increase your withdrawal with inflation and calculate your growth using the nominal rate of return.
This is how I have seen several other FIRE calculators built at least.
Thanks again.
M
LikeLiked by 1 person
Hi M,
You are correct, I am intentionally increasing the withdrawals or expenses by the inflation rate every year AND using the real rate of return (nominal return less inflation rate) to further stress the portfolio. This is my way of being VERY conservative when planning. I decided to always do my calculations this way after reading this article by Big ERN. He’s not my favorite source of information but his safe withdrawal series is really good. https://earlyretirementnow.com/2019/05/22/how-to-lie-with-personal-finance/ .
If you wanted to see “half” the effect of how I am applying inflation, you could halve the inflation rate that’s being applied in the calculator. So instead of using 2% inflation, enter 1%. What’s fun is that this is just one of many calculators out there. I must have run our numbers on 10 different calculators before I convinced myself we were going to be OK. Consider this just one arrow in your quiver.
Cheers, Alison
LikeLike
WOW. This is clearly a labor of love and skill. I’ve been playing and having fun with it already. This is such a great contribution to the community!
LikeLiked by 2 people
Thanks for that. We like to have fun with playing with our numbers and hope it’s an easy tool that will encourage others to do the same. Cheers!
LikeLike
Thanks for providing this tool! Something to play around with this weekend. Especially appreciate the section about Social Security. I hadn’t bothered to find out how to calculate social security income, since I assumed it would be insolvent by the time I would be eligible to receive it. Now that I know they have a tool to figure it out, I may as well check it out.
LikeLiked by 2 people
Never hurts to get the SS info. Then you can plug it in or even drop it down 75% or even 50%. Salt to taste!
LikeLike
Just ran a few calculations using their tool. It’ll be interesting to track the amounts with $0 projected income each year. Also saw the released statement that expects the trust fund to run out in 2035. The current advice is that only $790 of every $1000 in benefits will be paid out (79% – much different than my assumption of 0%!). 14 years are remaining for changes that could either improve or worsen that outcome.
LikeLiked by 1 person
I’m so glad you went to the SS site and ran some numbers. We cut our projected SS by 75% in 2035 just in case. It always helps to have the information regardless.
LikeLike
Great work! My spouse and I are tied to our current location for the time being while he receives medical treatments. Since I like my job, I’ve continued to work full-time. Lately, I’ve been seriously considering cutting back to part-time. Like you two, we like to consider ALL of our options. This calculator is great for running every scenario we can dream up. Thank you for all your hard work and passion.
LikeLiked by 1 person
Thanks. Sorry to hear about your spouse. I hope his treatment is successful and it opens even more options down the road. We love having the right tools to help us dream into our future. Good luck!
LikeLike
What a great tool!
Over the last month I’ve realized that I might have my number after running it through FIREcalc and cFirism and writing endless combinations down in my notes. Now, running your calculator, with the extra details and graph I’m feeling more confident that my math is likely right!
I appreciate you thoroughly explaining your reasons for deviating from 25x and the additional variables that come into play with a longer timeline. Some FIRE folks are adamant that 25x really has special, unfailing powers and I’m just not in agreement. I find my outlook much more in line with yours, and prefer to be cautious the first several (many?) years with a 3-3.5% withdrawal, and going higher in the subsequent years once my nest egg has (hopefully!) grown. I think the attitude of “I’ll just get a job if there’s a big downturn!” isn’t realistic for many people; jobs are 10x harder to come by in a recession, and even more so if you’ve been out of the workforce for many years (and especially if you aren’t a tech bro).
I’m a 100% single mom with a teen, so my financial future has a few more variables in it that I want to account for: college, and helping them enter their 20s on solid financial footing – without debts, living here for a spell if that helps them save money, and potentially helping them in a larger way such as seed money for a business, or helping with a down payment, or funding a 529 (like my parents generously did when my teen was born).
Thank you for being so detailed in your writing and explaining your thinking so thoroughly – here and in your other posts!
LikeLiked by 1 person
You are very welcome. We too ran our numbers through every calculator we could get our hands on. And by pushing our 25x number up to 30x then 33x, we felt even more comfortable. We wanted to be in a situation where we did not have to get a job if there was a prolonged down turn for all the reasons you mentioned. And congratulations!
LikeLike
[…] We still have a long way to go but I’m having fun playing with All Options Considered’s newest FI calculator. […]
LikeLiked by 1 person
[…] Without a crystal ball it’s impossible to predict exactly how long a portfolio might last. But coming up with a baseline prediction is still an important part of the process. If you want to run your own estimate check out the spreadsheet we share, our Simpli-FI-ed Calculator. […]
LikeLike